


Ethereum Hit 3.6M Transactions ATH and a Channel Floor in the Same Week
ETH
 BULLISH
 SPIKE
SPIKE
 APRIL
APRIL
 WOULD
WOULD
Key takeaways:
- Transaction count ATH: 3.61M on April 12.
- Price up 5% on the week, peaked at $2,425 on April 17.
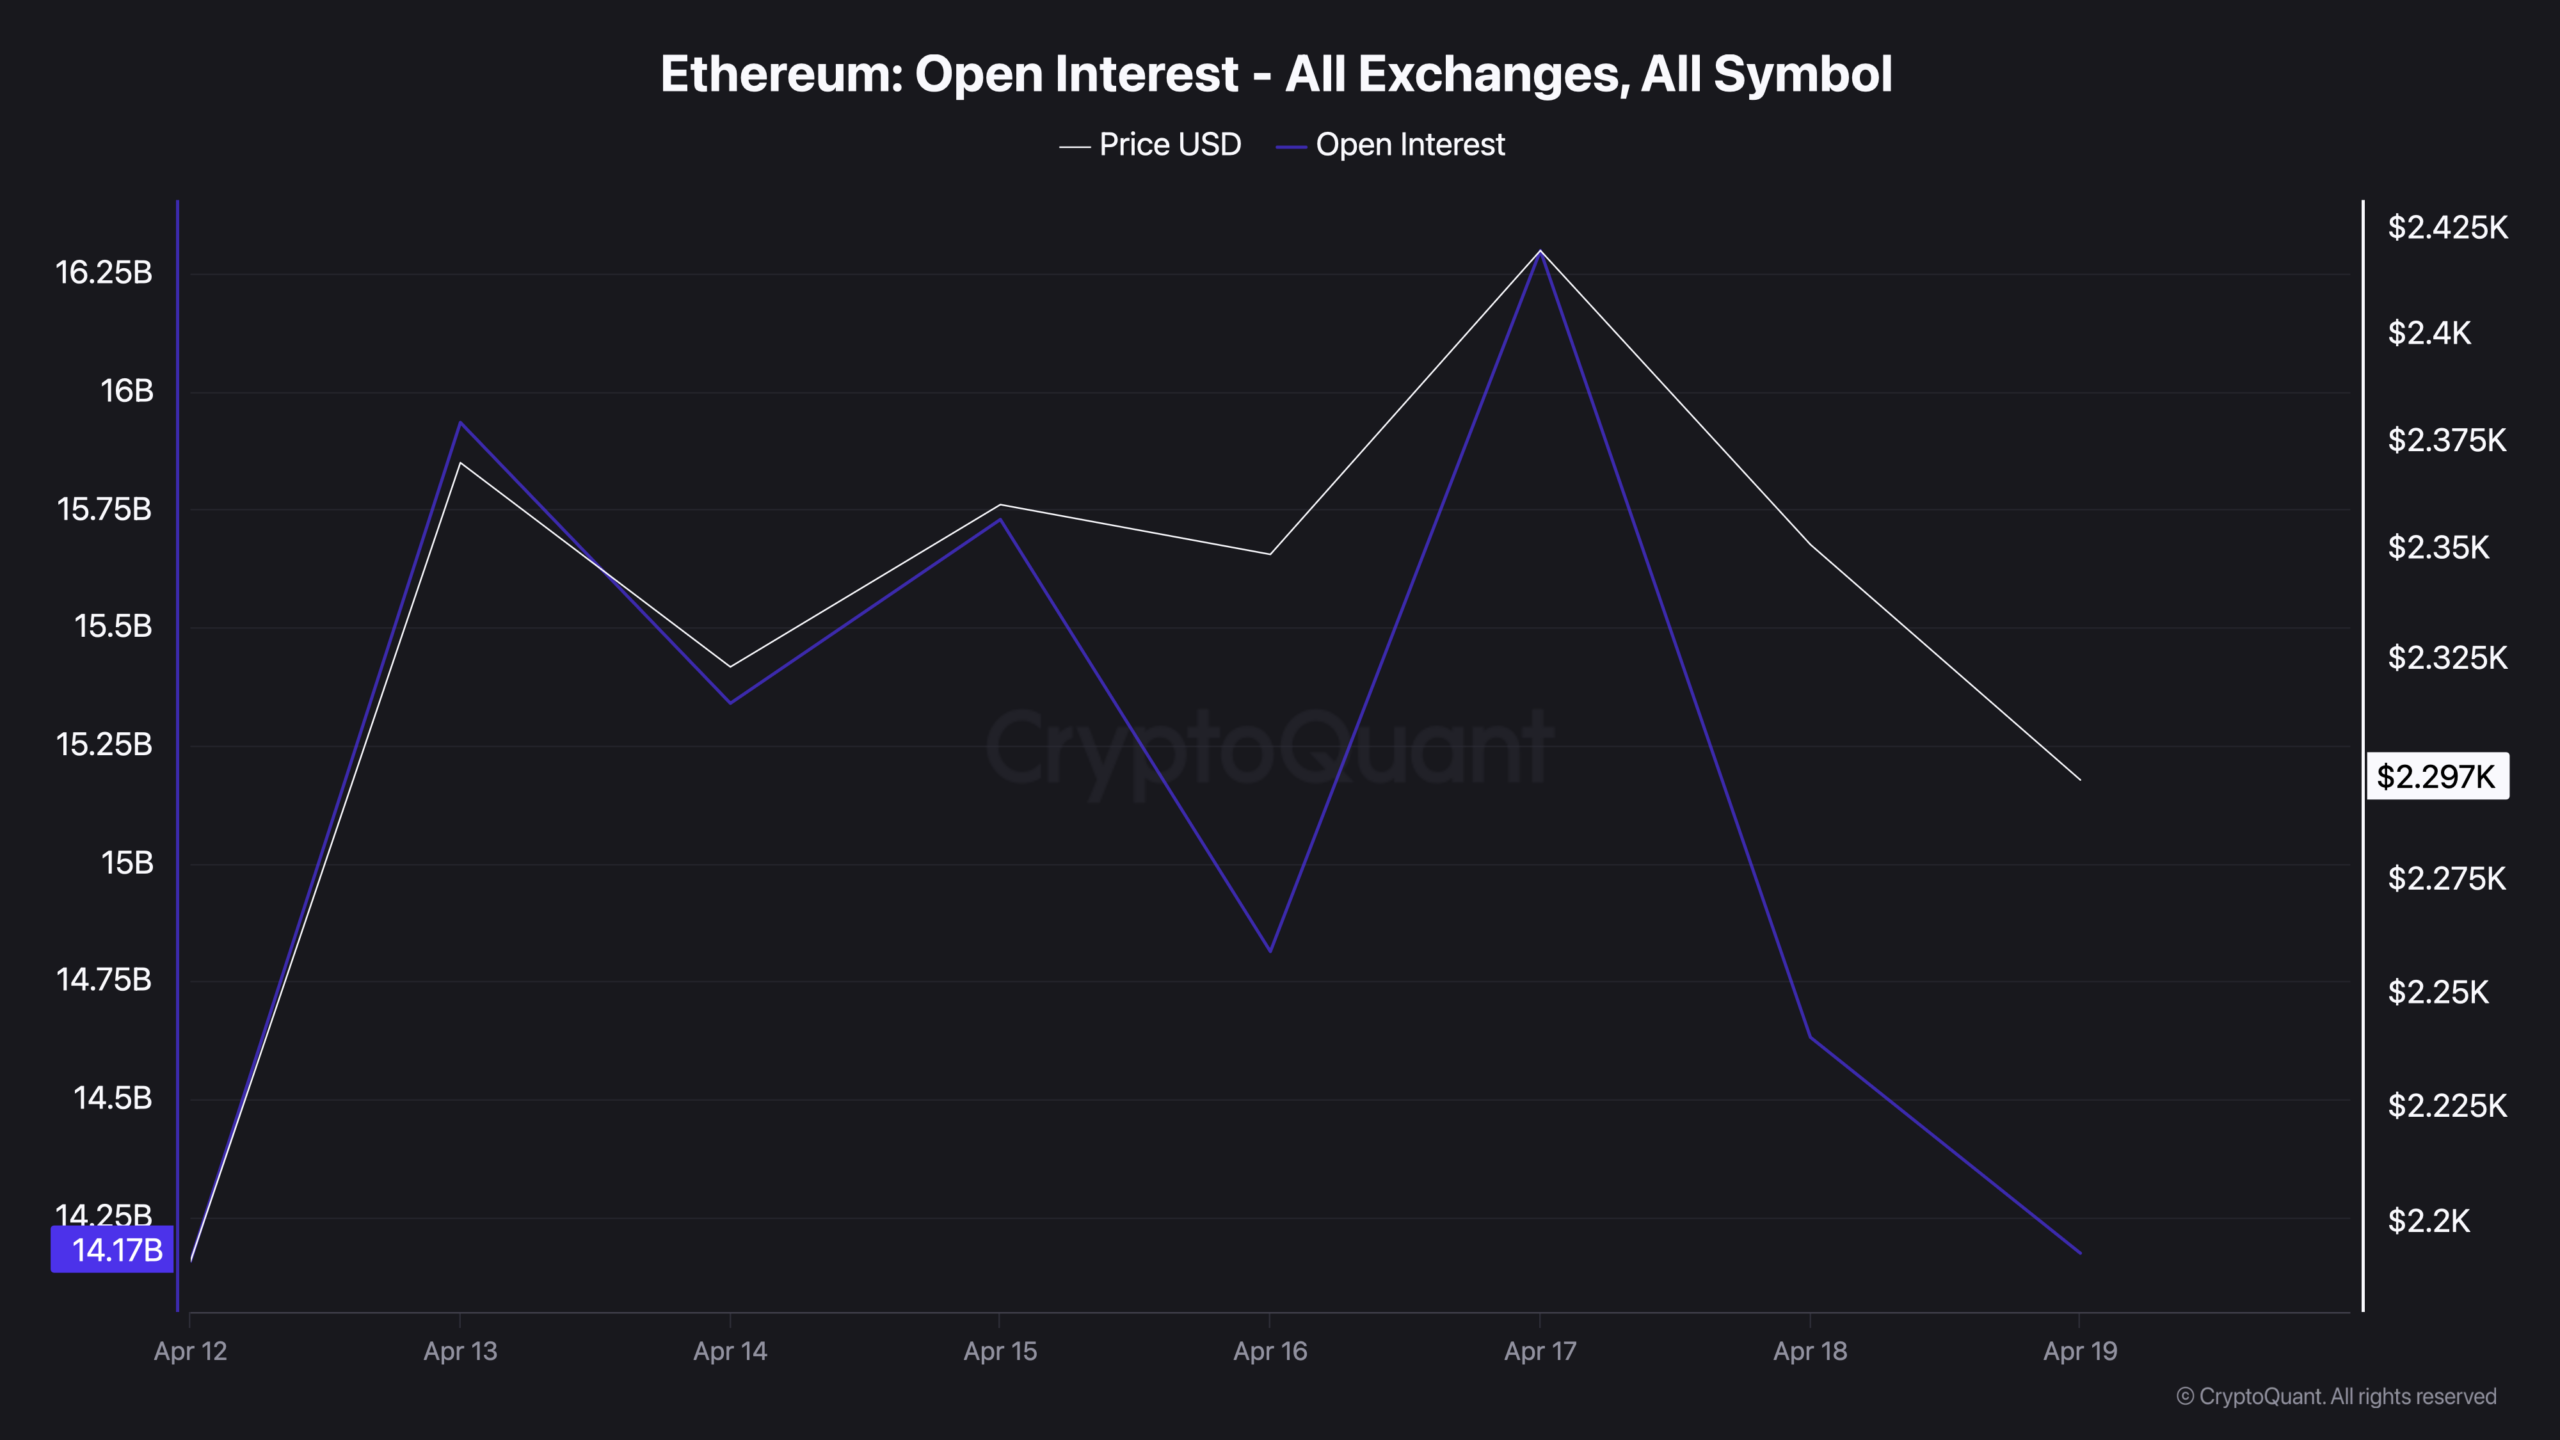
- Mid-week leverage flush wiped $2B in open interest in 48 hours.
- Taker ratio at 0.916, sellers now the aggressive party.
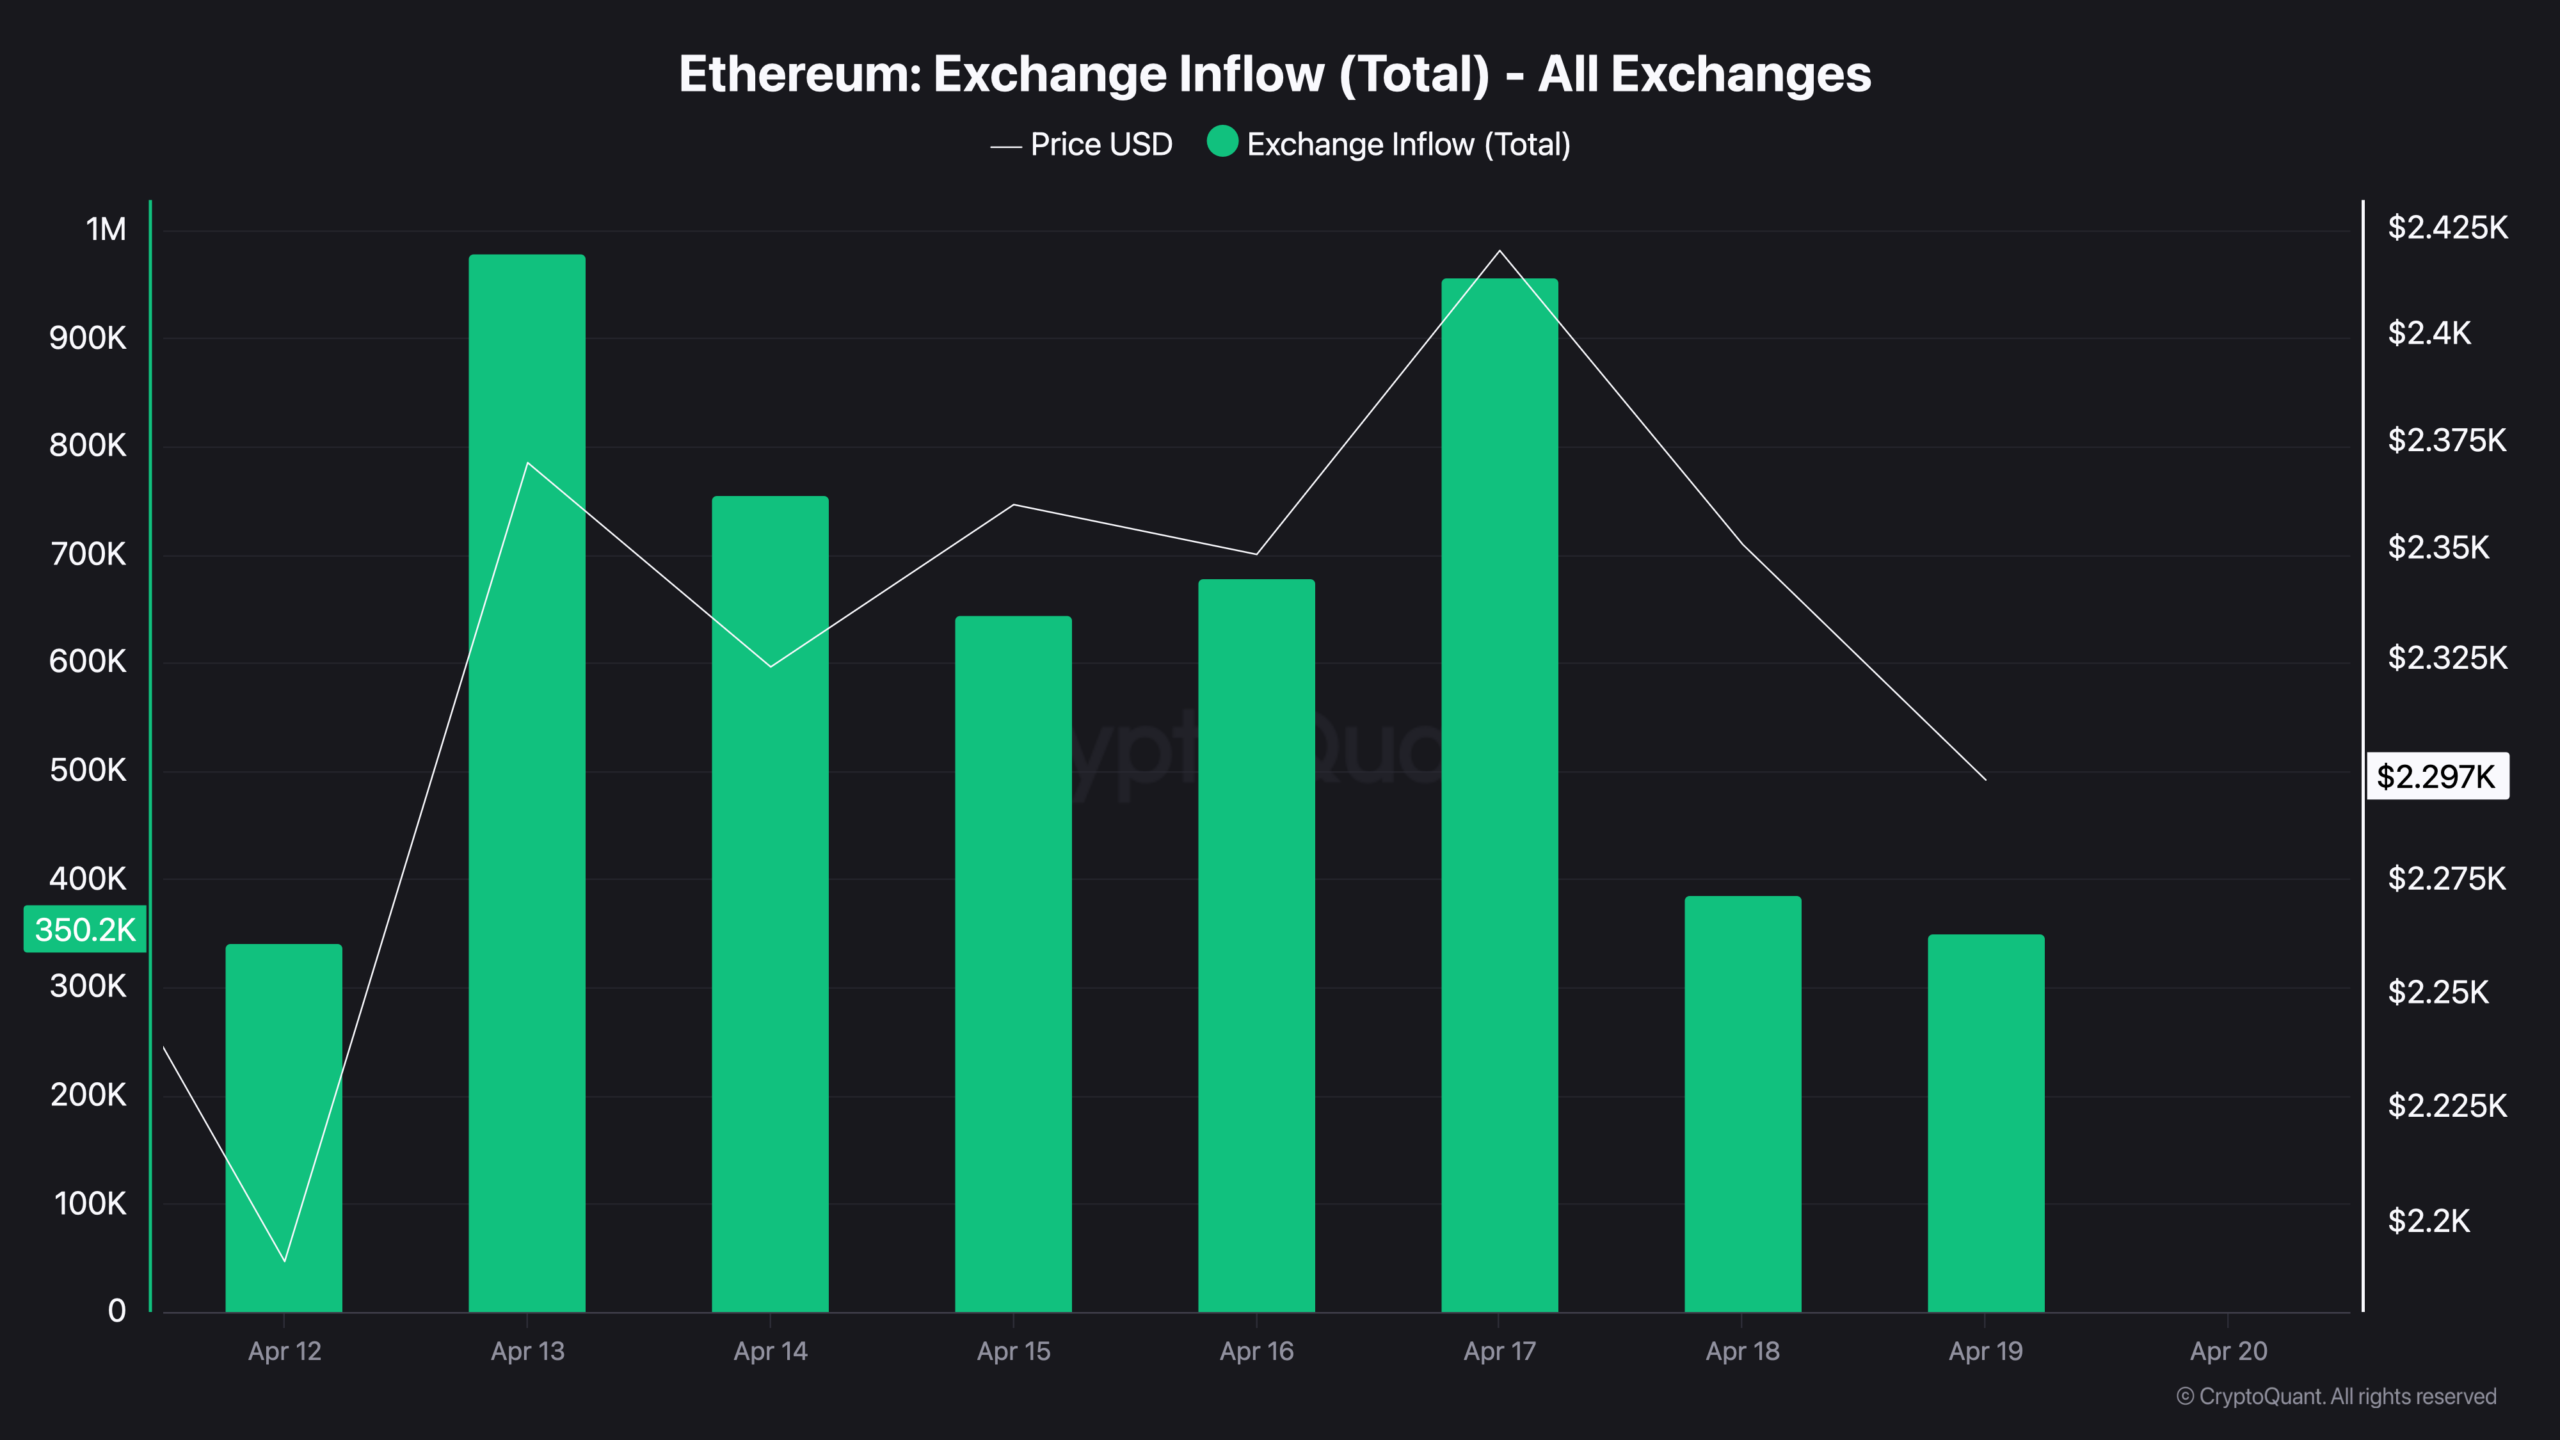
- Exchange inflows fell from 970K to 350K ETH post-peak.
- ETH withdrawn from exchanges during selloff, not sold.
- Network and speculative layer pointing in opposite directions.
On April 12, Ethereum processed more transactions in a single day than at any point in its history, 3.61 million. Price that same day was sitting near $2,200, the low end of what would become a volatile week. The network had never been more active. The market was not paying attention.
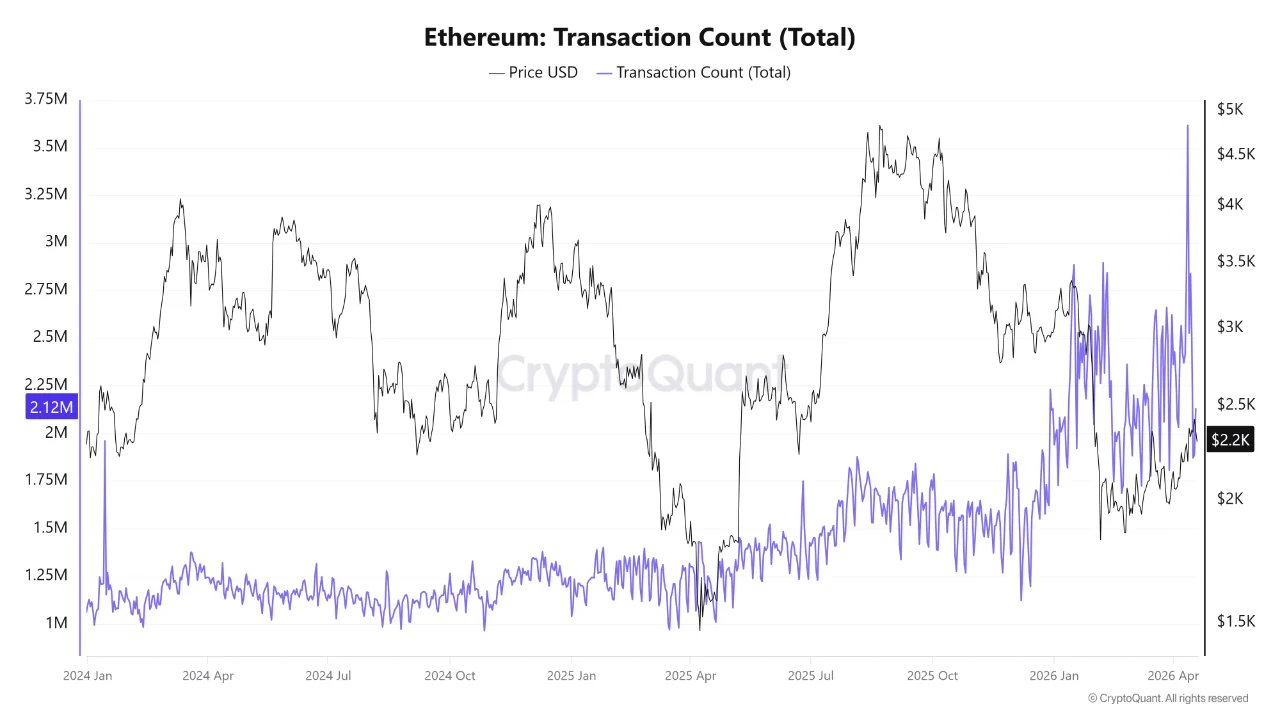
That gap, record infrastructure usage against depressed price, is the lens through which everything that followed needs to be read. Because the week did not resolve the contradiction. It deepened it.
A Supply Spike Got Absorbed Then Leverage Took Over.
From April 12 to April 17, ETH climbed from $2,200 to $2,425. What the price chart does not show is what had to happen for that move to work. Exchange inflows spiked to roughly 970,000 ETH on April 13, nearly a million ETH deposited onto trading platforms in a single day, the kind of flow that usually precedes selling pressure.
Instead, price kept climbing. The taker buy/sell ratio, which tracks whether buyers or sellers are initiating trades in derivatives markets, recovered from 0.916 on April 12 and held above 1.0 through the entire move, according to CryptoQuant data. Price does not climb through that kind of supply unless real demand is behind it.
But the fuel behind it was leverage. Open interest climbed from $14.17 billion to $16.25 billion across those five days, $2 billion in new borrowed positions tracking price in near-perfect lockstep. A move where derivatives positioning drives price leaves a fundamentally different structure than one built on spot demand. The April 12 transaction ATH suggested real network activity underneath. The OI data suggested a speculative layer on top was doing most of the price work.
When Every Metric Peaks on The Same Day, the Rally is Already Over
April 17 was the day price, open interest, the taker ratio, and exchange inflows all printed their weekly highs simultaneously. That kind of convergence is not a bullish confirmation — it is a sign that everyone who was going to buy has already bought. The taker ratio at approximately 1.065 still technically favored buyers, but it peaked without any follow-through above $2,425. There was no second leg.
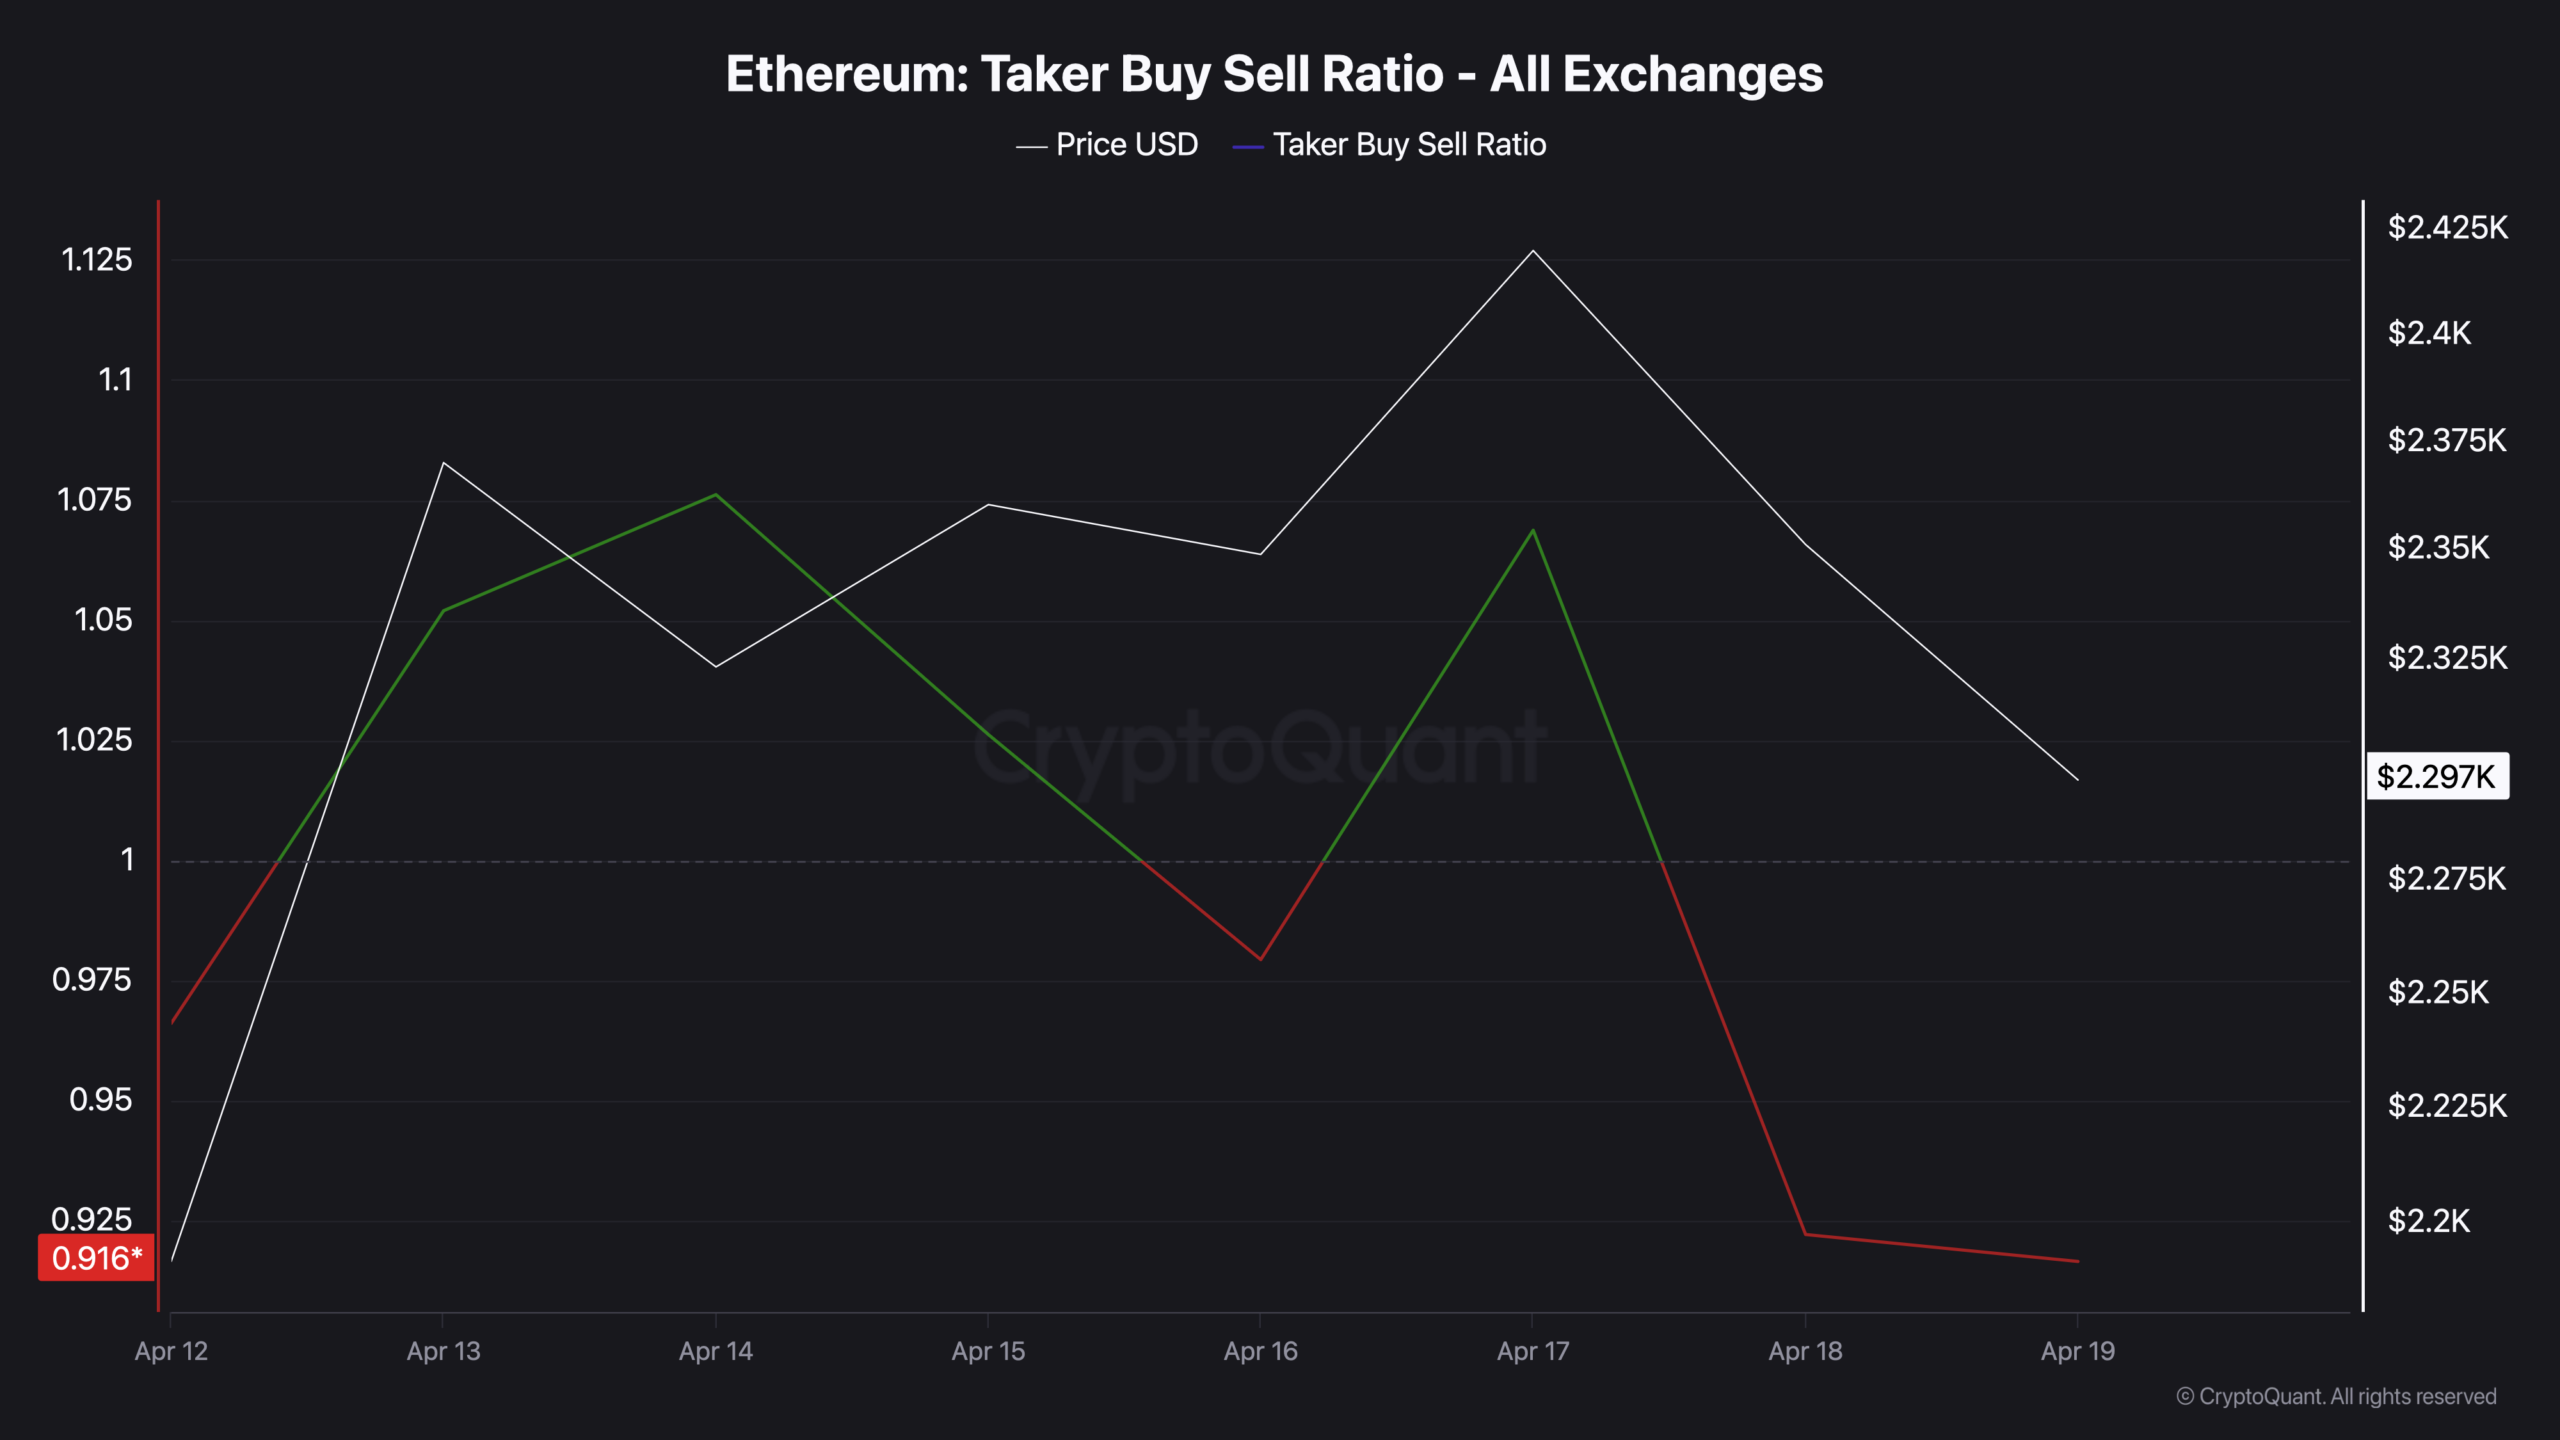
What followed was fast. Open interest dropped $2 billion in 48 hours, returning to exactly its April 12 starting point. The taker ratio collapsed to 0.916, sellers took over as the initiating party. Exchange inflows fell to around 350,000 ETH, less than a third of the April 13 peak. The leveraged positioning that built the rally was cleared out in two days.
ETH Left Exchanges During the Selloff
Here is where the data stops being a simple story of a failed rally. Exchange reserves, the total ETH held across all exchange wallets, rose steadily from 14.79 million during the rally, tracking the inflow data as expected. Then, after the April 17 peak, they fell sharply back toward 14.79 million even as price was dropping.
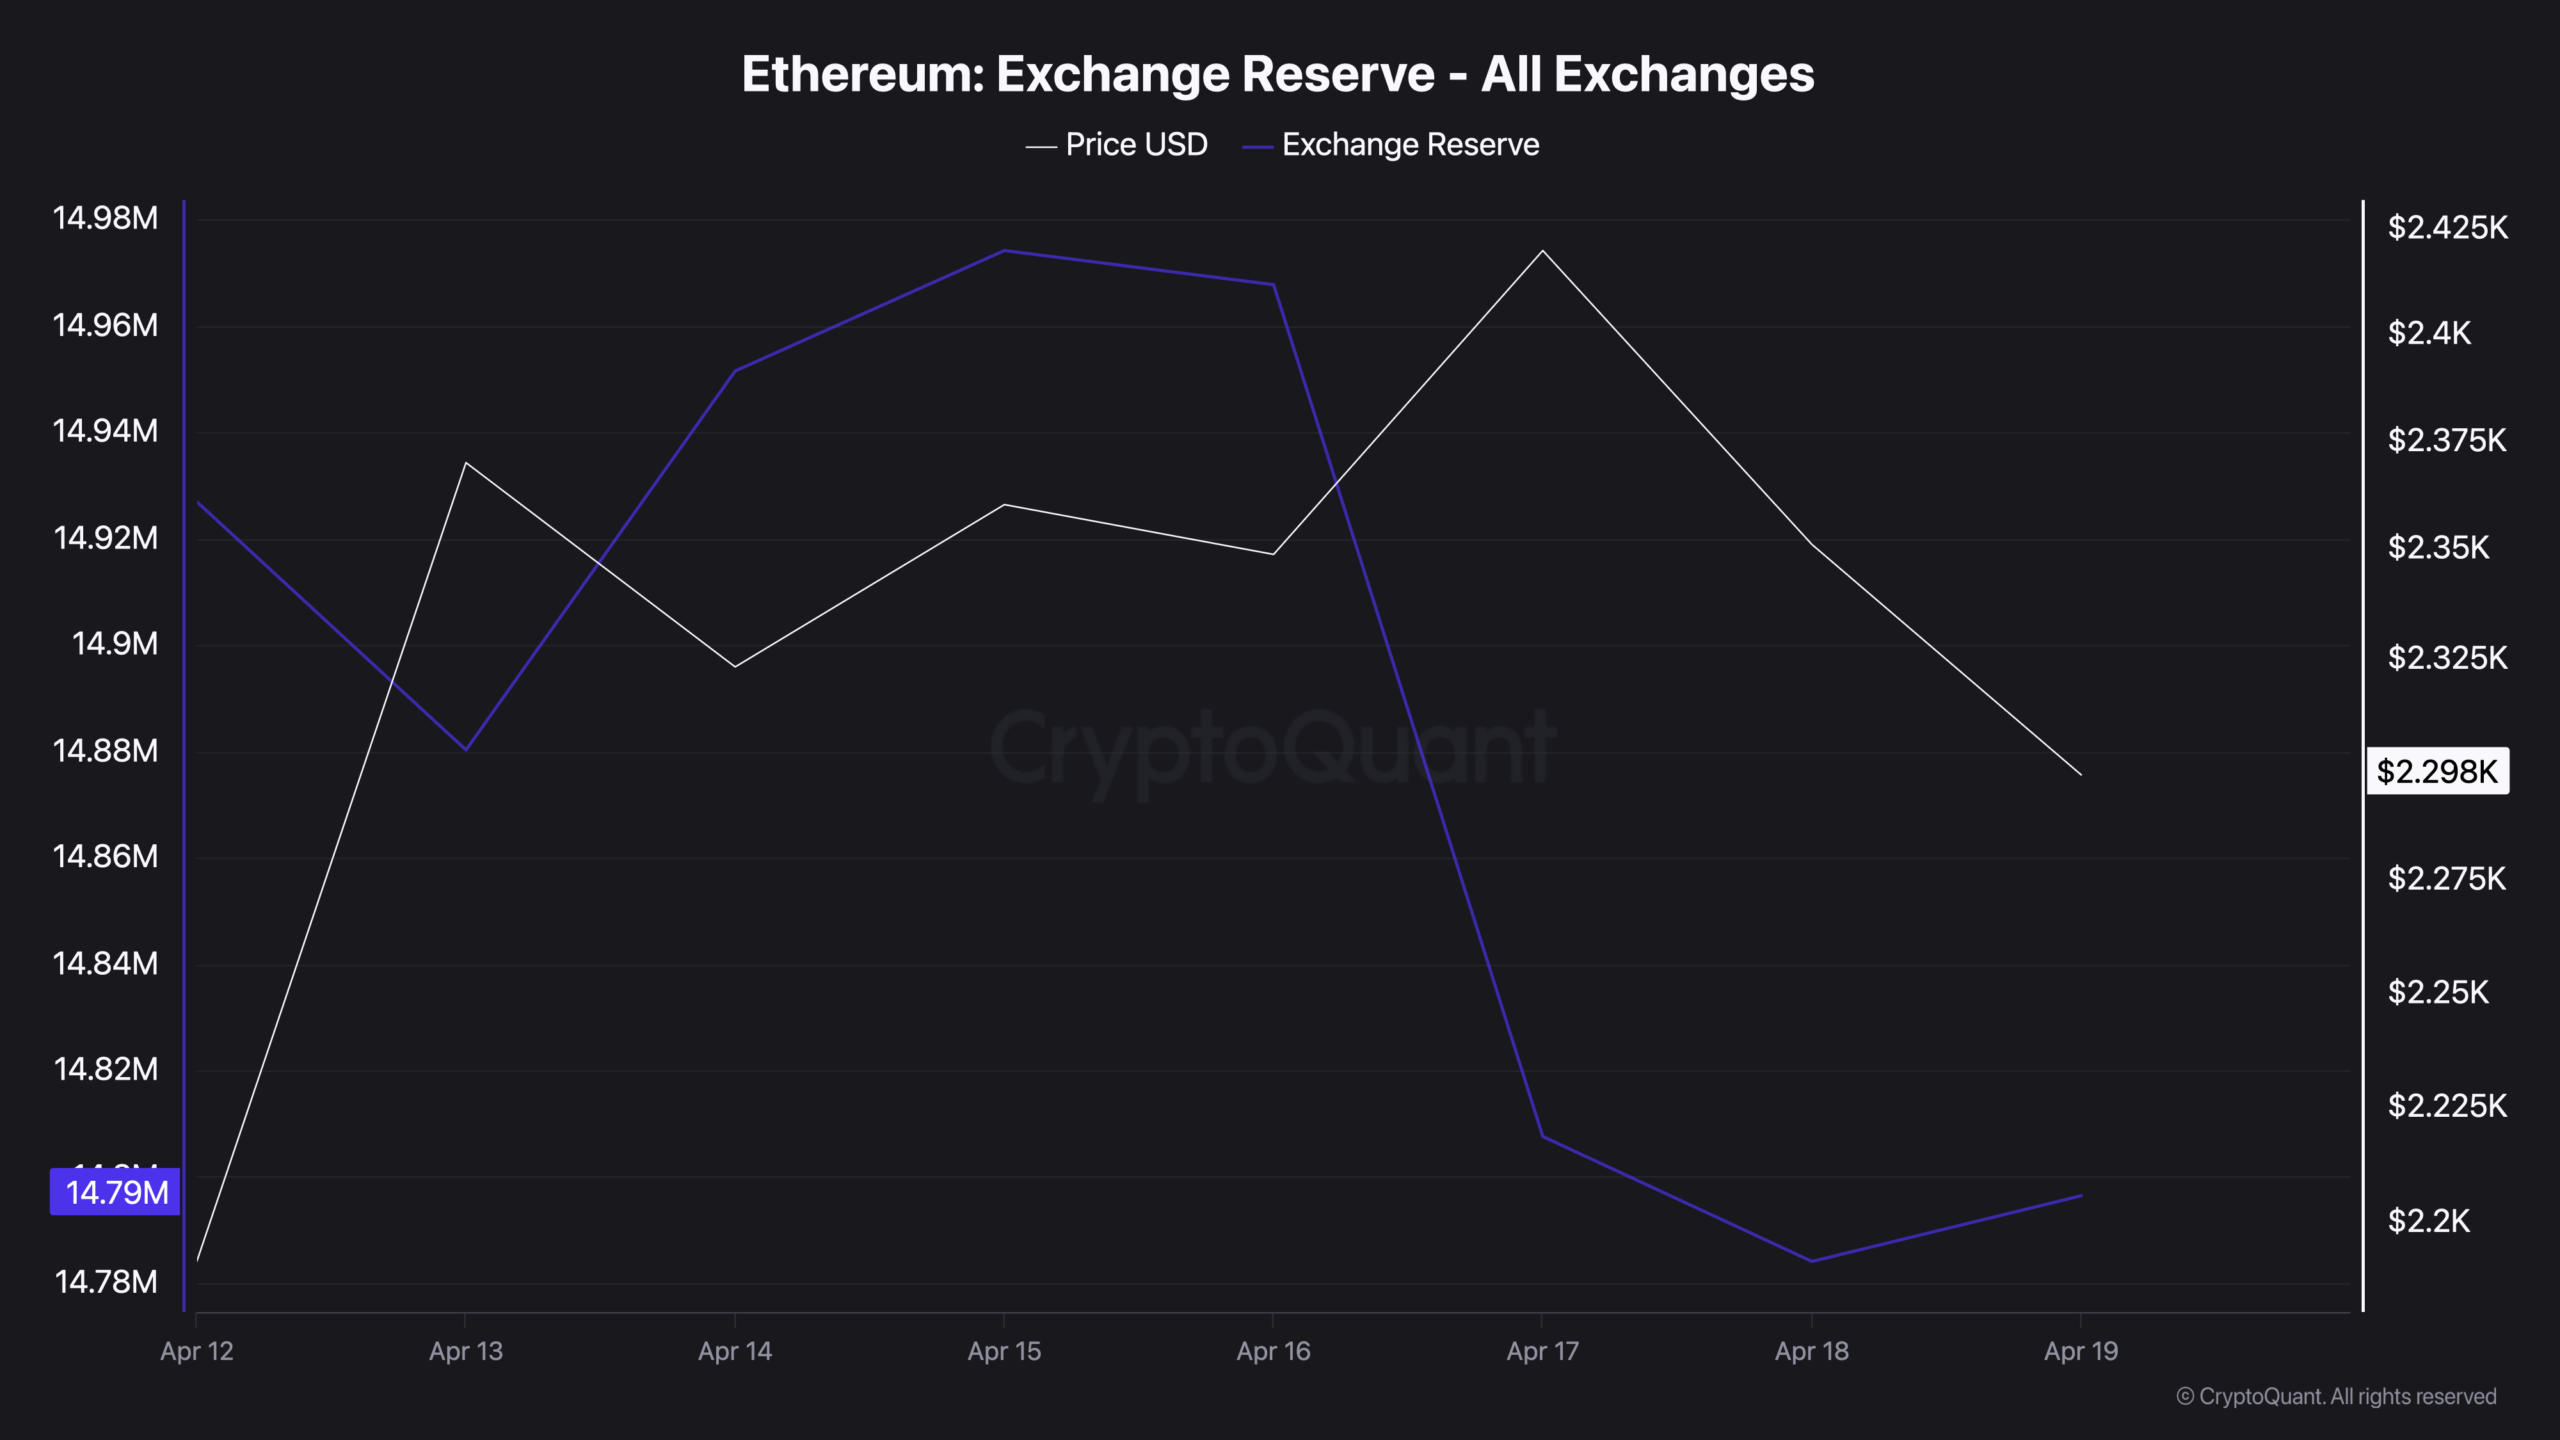
When price falls and exchange reserves fall simultaneously, it means ETH is being withdrawn from exchanges rather than sold on them. Holders moved coins off trading platforms during the downturn. That is the opposite of panic behavior, it is the on-chain signature of participants who looked at the dip and decided to hold custody rather than sell. That signal sits in direct tension with the aggressive taker selling visible in the same 48-hour window. Two different types of participants, making two different decisions, at the same time.
The Leverage is Gone
The weekly gain is real. The rally that produced it was built on leverage that is now gone.
What remains after the flush is more interesting than the flush itself. The transaction ATH has not been revised away, 3.61 million daily transactions on April 12 stands as a genuine record, driven by L2 settlements and smart contract activity that have nothing to do with speculative positioning.
Exchange reserves ended the week near where they started, but with the composition changed, the ETH that left during the selloff went to self-custody, not to sell orders. And open interest reset entirely, meaning the next move, if it builds, will do so without the weight of last week’s crowded positioning overhead.
The speculative layer got flushed. The infrastructure layer kept setting records. If sustained network activity at these levels begins attracting spot demand rather than derivatives positioning, the structure of the next move will look materially different from what just failed.

Price is at Channel Support
The 4-hour chart adds a layer the on-chain data alone cannot provide. Since early April, ETH has been trading inside a well-defined ascending channel, a pattern where both the highs and the lows are rising in parallel, signaling that despite the volatility, the broader trend structure has not broken. Price is currently sitting at $2,295, directly on the lower boundary of that channel.
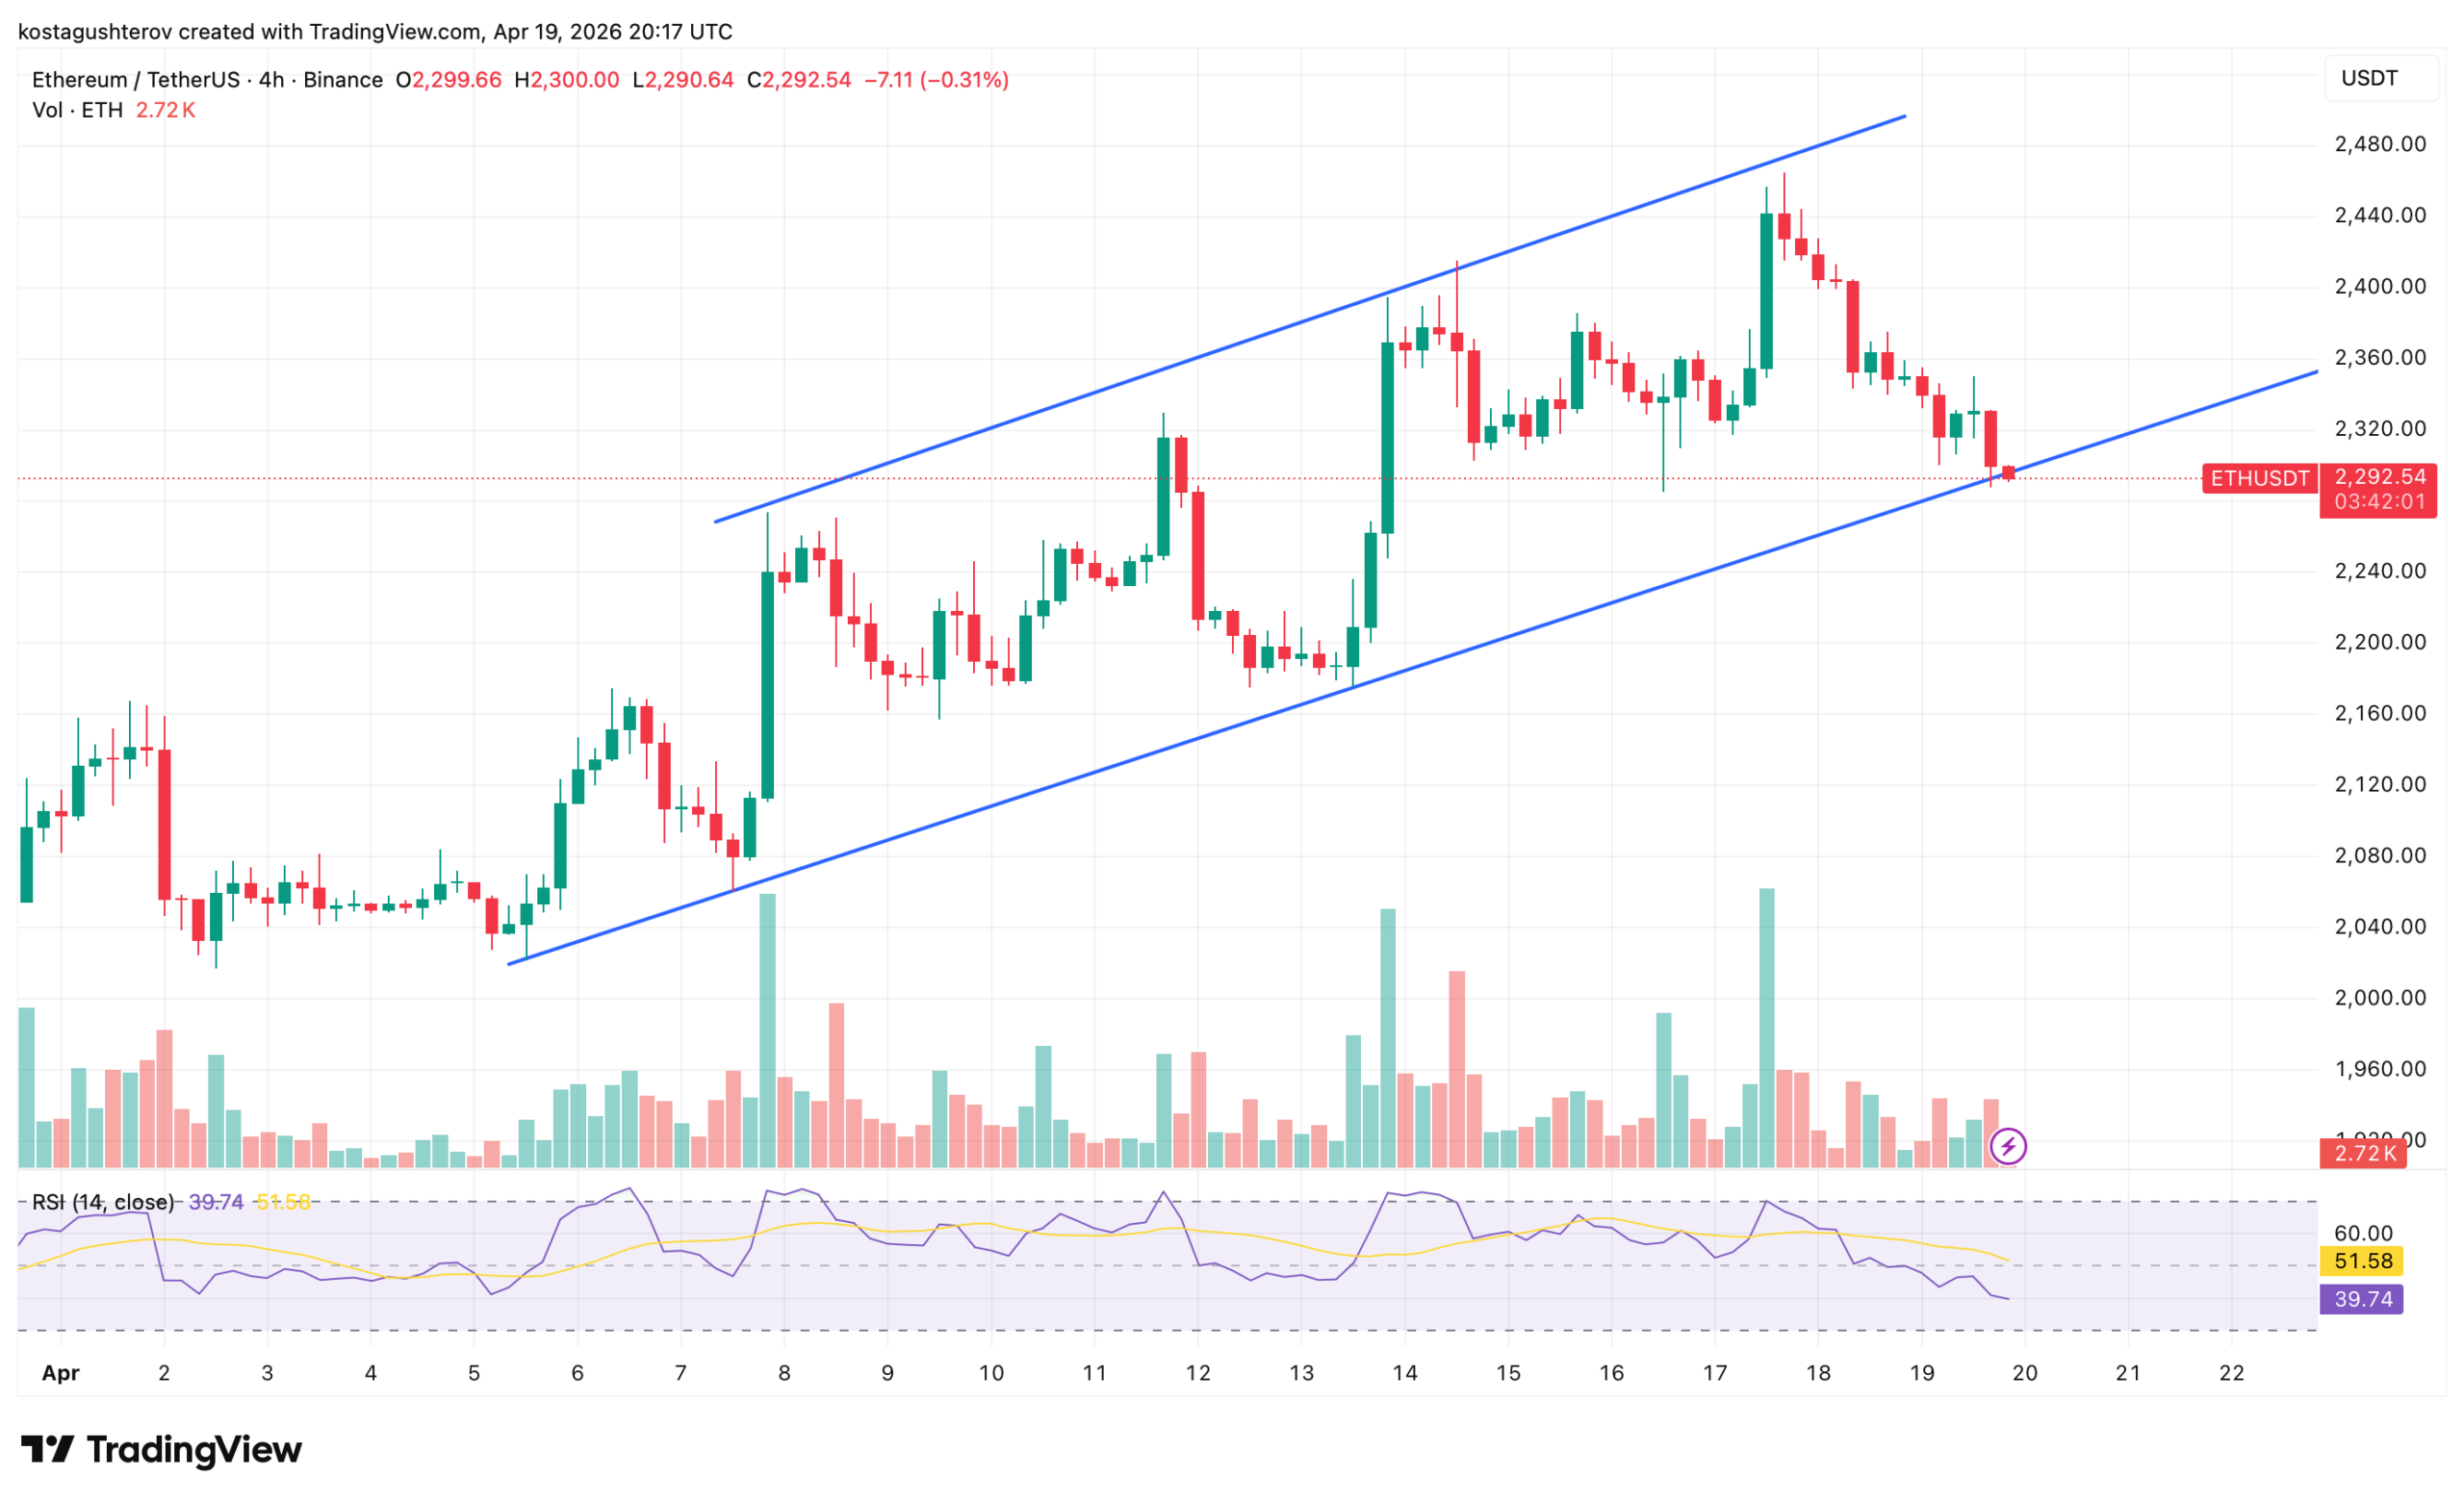
That location matters. The lower channel boundary is not just a trendline on a chart, it represents the level where, across multiple prior tests, buyers have stepped in and defended price. The April 17 spike to $2,460 briefly pierced the upper boundary before getting rejected sharply, which is what drove the aggressive selloff of the past 48 hours. That move brought price all the way back to where the channel begins to offer support again. A false breakout above, followed by a return to the lower boundary, is a textbook reset within an uptrend, painful for traders caught at the top, but structurally not a trend break.
The RSI at 40.29 on the 4-hour timeframe reinforces the picture. It has crossed below its own signal line and is approaching the oversold zone, the same zone from which ETH bounced on April 12 before the rally began. Selling momentum is elevated, but it is running into a technical area where it has historically exhausted itself.
The variable the chart cannot price in is macro. The developing situation between the US and Iran has kept a risk-off tone across global markets through the latter part of the week, and crypto has not been immune to it. Any de-escalation, a diplomatic signal, a ceasefire headline, a reduction in the perceived probability of direct conflict, removes the external pressure that has been pushing price toward the lower boundary in the first place. If that catalyst arrives while ETH is holding channel support with RSI near oversold and open interest fully reset from last week’s crowded positioning, the confluence creates a setup where a move back toward the channel midline around $2,380 to $2,400 becomes the path of least resistance, with the upper boundary near $2,480 as the range target if momentum follows.
None of that is guaranteed. The channel breaks if price closes a 4-hour candle meaningfully below $2,280. That would shift the technical picture entirely and open the conversation about a retest of lower levels. But as of the time of writing, the structure has not broken, and the on-chain data showing ETH leaving exchanges rather than being sold into them suggests the participants most likely to defend this level have already made their decision.
The information provided in this article is for educational purposes only and does not constitute financial, investment, or trading advice. Coindoo.com does not endorse or recommend any specific investment strategy or cryptocurrency. Always conduct your own research and consult with a licensed financial advisor before making any investment decisions.
The post Ethereum Hit 3.6M Transactions ATH and a Channel Floor in the Same Week appeared first on Coindoo.
