


Ethereum’s Taker Pressure Is Rising: A Whale Is Betting Against It
ETH
 GHOST
GHOST
 BULLISH
 TAKER
TAKER
 USDC
USDC
Key Takeaways
- Ghost wallet shorted $20M of Ethereum
- Taker buy pressure mirrors 2025 surge pattern
- Sharpe ratio signals weak risk-adjusted returns
Ethereum is holding just above the $2,000 psychological threshold this Tuesday afternoon, but the signals embedded in the day’s data are anything but uniform.
A newly created wallet has quietly placed one of the largest single leveraged short bets seen on HyperLiquid in recent weeks, staking nearly $5 million in collateral against a $20 million ETH position. At the same time, aggregated buy pressure across spot exchanges is trending upward in a pattern that analysts are already comparing to the weeks before ETH’s sharp April–May rally last year.
Meanwhile, the risk-adjusted return picture remains deteriorated, a Sharpe-like ratio sitting in negative territory reflects a market where holding ETH over the past month has not compensated investors for the volatility they absorbed.
What we have, in other words, is three data layers each telling a different story. That kind of divergence doesn’t resolve quietly.
The Whale in the Room
On-chain monitoring service Hypurrscan flagged the position earlier today. A wallet with no prior transaction history – a clean-address indicator often associated with either institutional participants segregating risk or sophisticated traders protecting anonymity – deposited $4.89 million in USDC into HyperLiquid’s perpetuals platform within the span of a few hours. The funds were split into two tranches of roughly $2.44 million each, arriving from a separate wallet address before being deployed into a short position on ETH-USD.
The scale of the bet warrants attention on its own terms. The trader entered short on 9,887 ETH, nearly ten thousand tokens, at an average entry price of $2,021.63, using 20x leverage to control a notional position valued at approximately $20 million. That ratio means even a modest upward move in ETH’s spot price applies disproportionate pressure to the position.
Position Data – HyperLiquid Perpetuals:
- Collateral Deposited: $4.89M USDC (newly created wallet)
- ETH Short Size: −9,887 ETH
- Position Value: $20M at 20× leverage
- Entry Price: $2,021.63 avg. fill
- Liquidation Price: $2,466.02 (~21.5% above entry)
- Break-even: $2,020.03
The liquidation threshold is the number that gives this position its particular contour. At $2,466.02, the trader is betting that ETH will not rally more than roughly 21.5% from their entry price before they choose to exit or adjust. That is a meaningful cushion, but not an extraordinary one in an asset class known for multi-hundred-dollar intraday swings during periods of volatility. The position currently sits roughly $37 in profit per token, or about 1.8%, based on the current spot price near $2,058.
Why it matters: New-wallet whale entries on perpetuals platforms are routinely tracked as potential directional signals. A $20M short opened today, if correct, profits on any meaningful ETH decline. If wrong, it becomes liquidity for the opposite move, a large forced-buy that can accelerate upward price action.
What the Chart Is Actually Saying
Pull up the ETH/USDT hourly chart on Binance and the immediate picture looks less dramatic than the whale data might suggest. As of time of writing, ETH is trading at $2,058, a modest gain of +0.4% on the hour, with the candle structure showing controlled buying rather than directional momentum. Volume this hour registered 1.52K ETH—within normal intraday range.
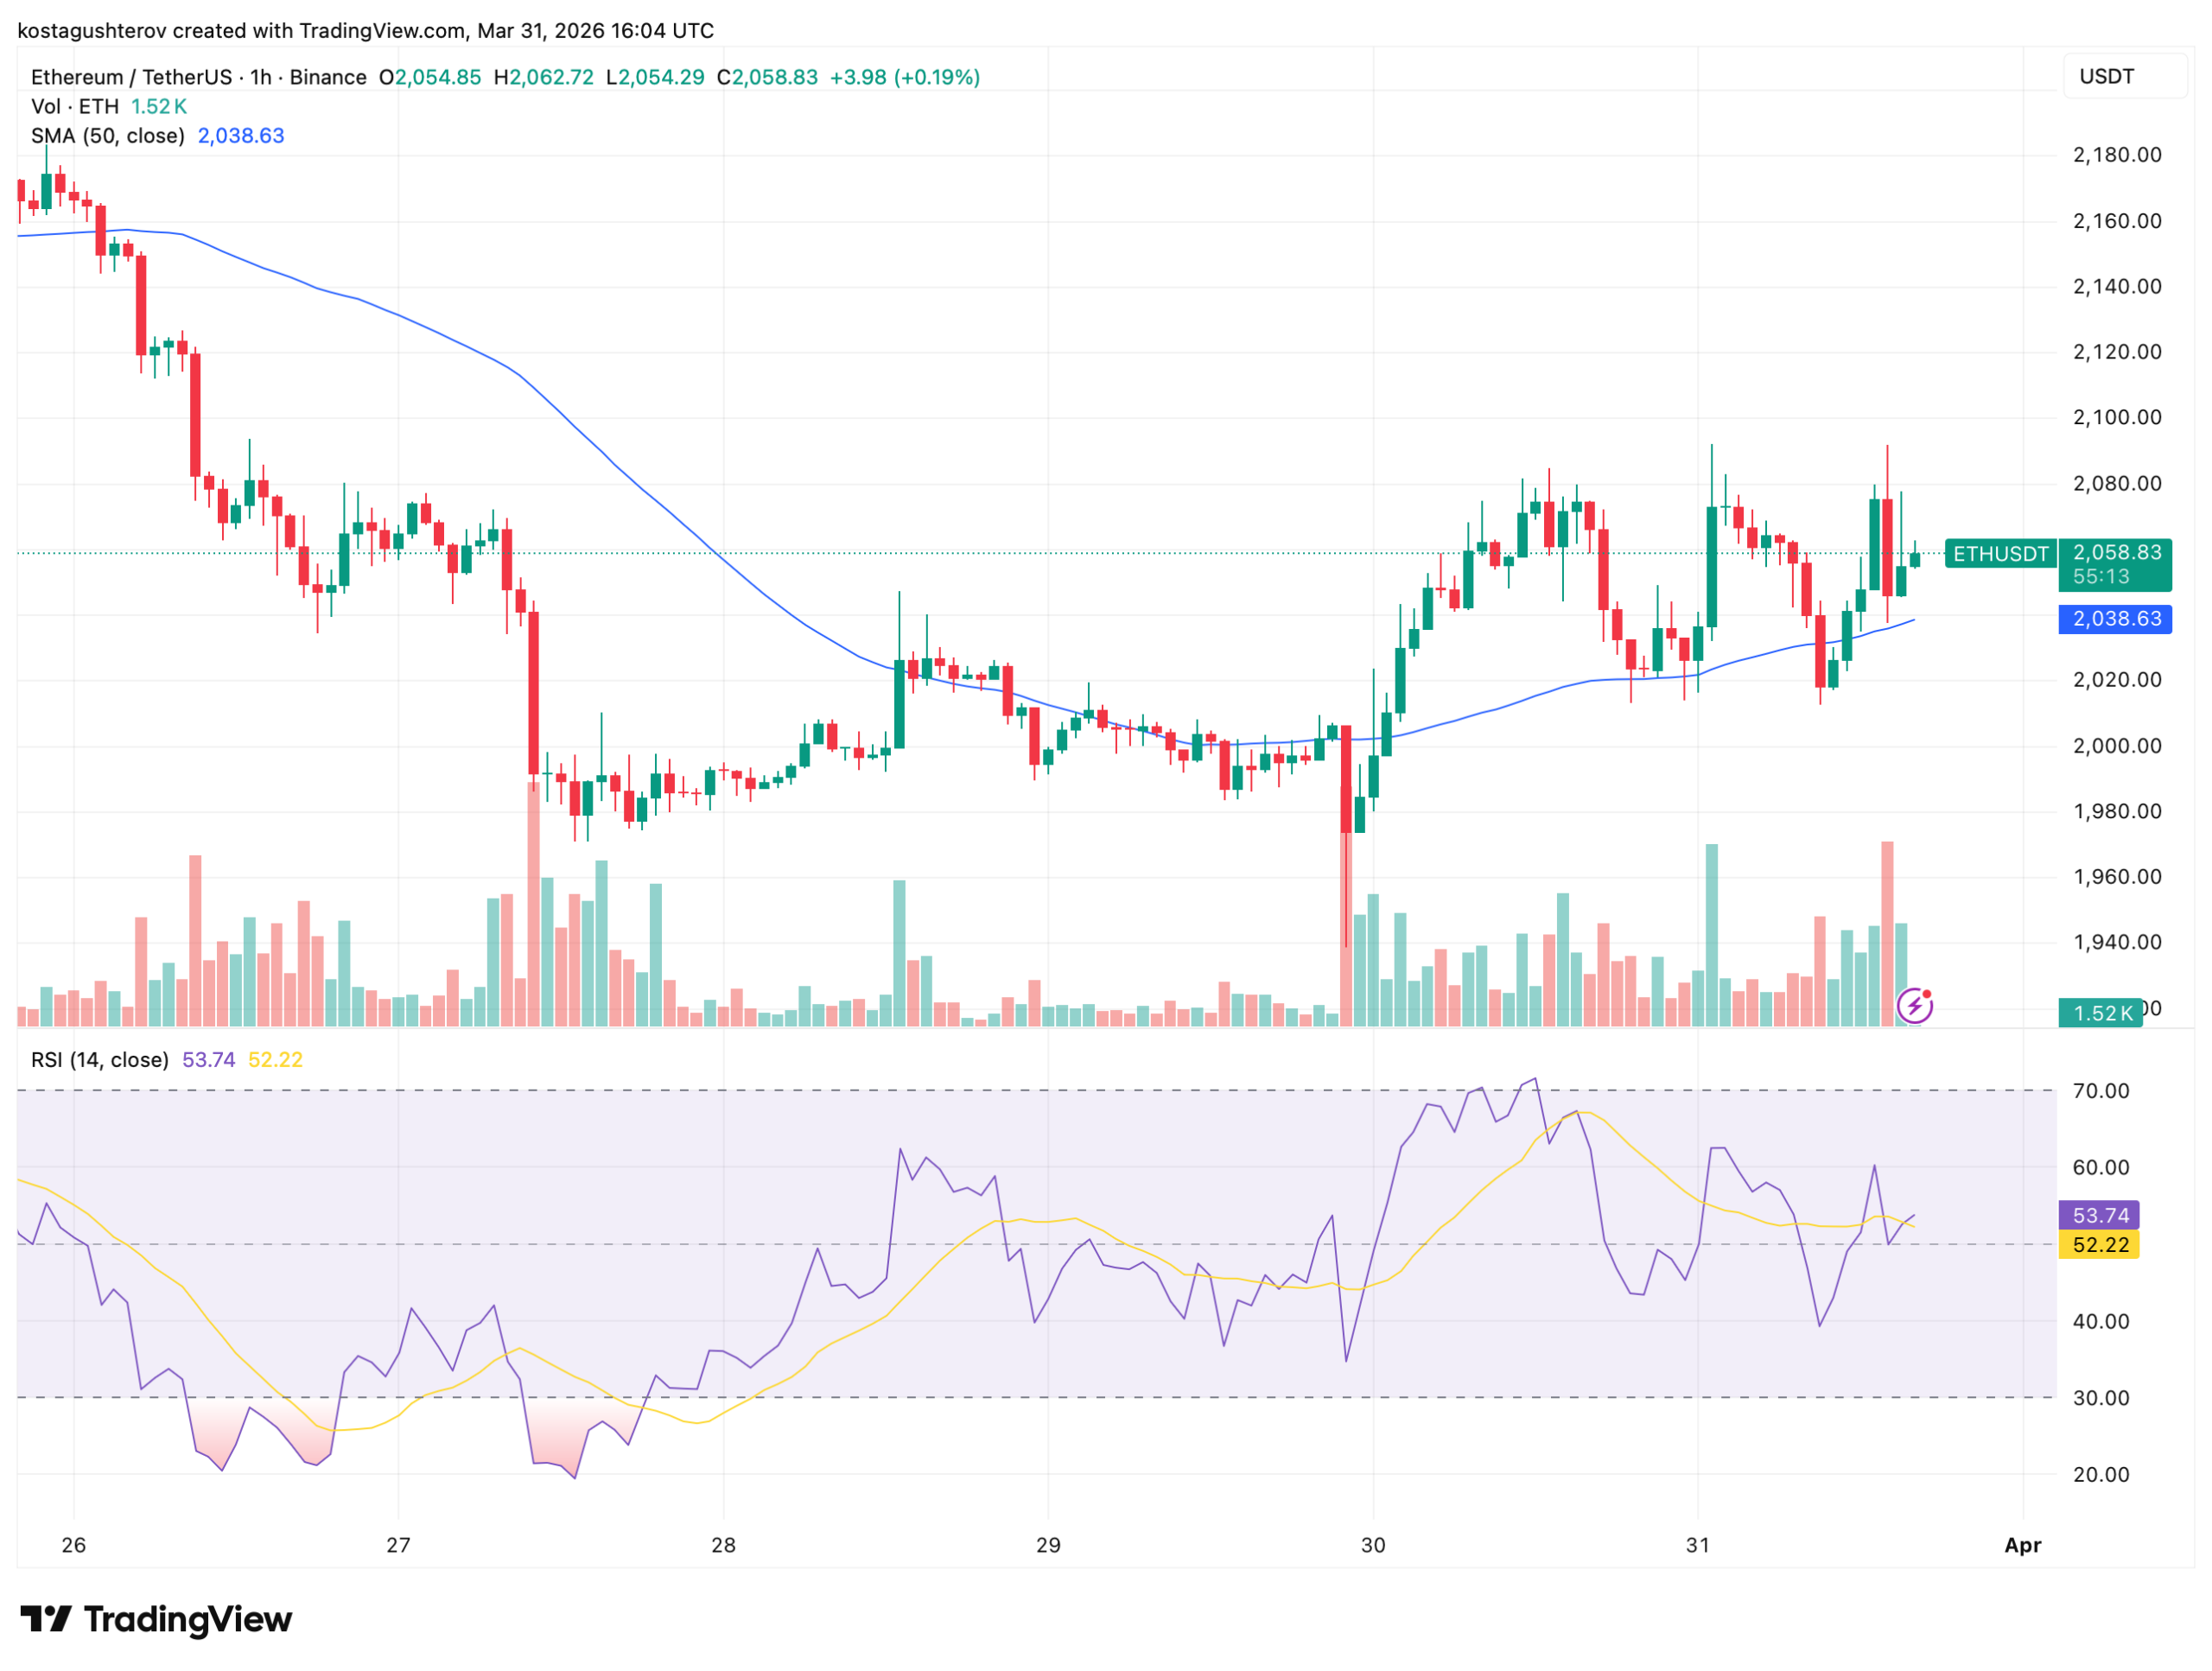
The 50-period simple moving average sits at $2,038.63, and price has spent most of the past two days trading above it after reclaiming that level on March 30 following a sharp wick down toward $1,960. That recovery, which produced one of the more significant green volume bars visible on the chart, has since resulted in a consolidation range roughly bounded by $2,020 on the low end and $2,090 toward the top.
The RSI reading of 53.74 (signal line at 52.22) is as middle-of-the-road as the indicator gets. There is no meaningful overbought signal pushing against the short thesis, but neither is there the kind of oversold exhaustion reading that would invite aggressive long positioning. The market is, in a word, undecided.
The prior week’s price action adds useful context. ETH dropped sharply from roughly $2,160 on March 26 down to the low-$1,960s by March 27, a decline of nearly 9% in roughly 24 hours. The subsequent recovery has been gradual and uneven, with multiple failed pushes toward $2,100 and a notable pullback on March 30 before the current stabilization. That sequence, sharp drop, slow recovery, repeated resistance—tends to favor range continuation rather than immediate directional resolution.
The Sharpe Ratio Problem
Zooming out to the on-chain analytics layer, CryptoQuant data tells a less flattering story about ETH as a risk-adjusted holding over the past month. The 30-day average return for Ethereum on Binance stands at −0.00039, and the resulting Sharpe-like ratio has dipped to approximately −0.0012.
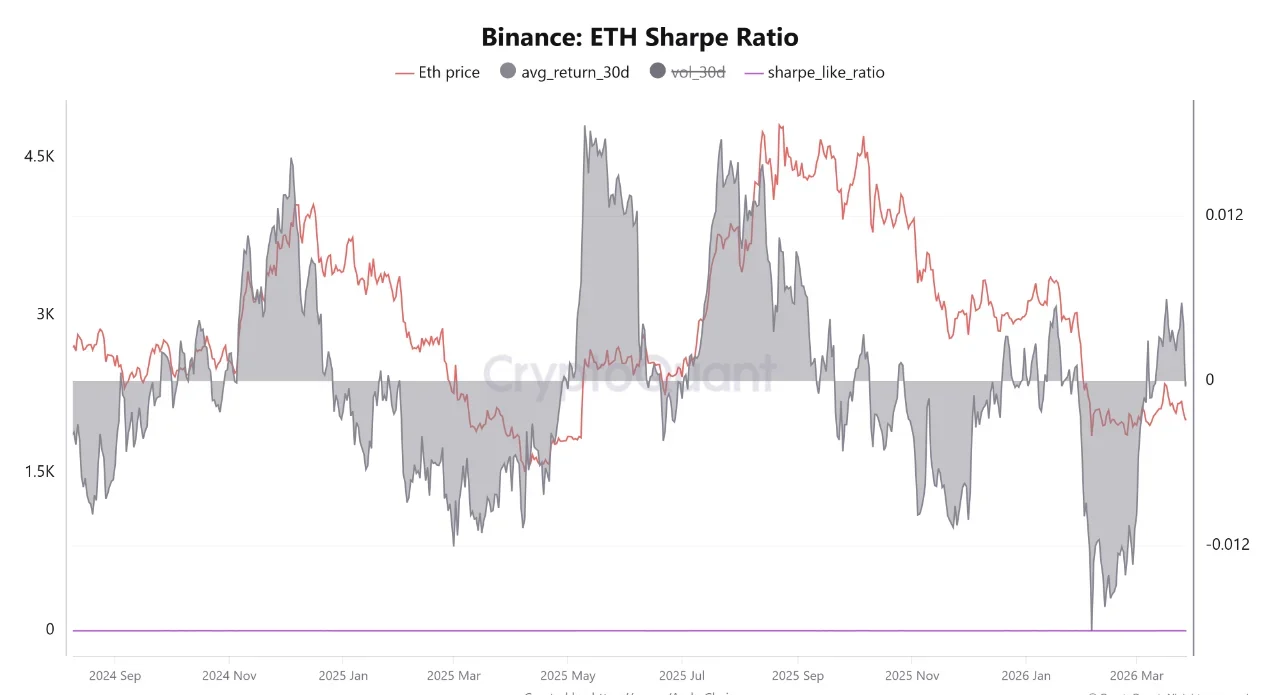
These figures may appear small in absolute terms, but their direction is significant. A negative Sharpe-like ratio indicates that investors holding ETH over the measured period absorbed real volatility without being compensated by proportional returns. The chart, which spans from September 2024 to the present, shows that the current reading places ETH near its weakest risk-adjusted performance level of the entire timeframe, worse than the periods of consolidation in late 2024, and approaching territory last seen during the prolonged drawdown of early 2025.
Signal Summary:
- Sharpe-Like Ratio (30d): −0.0012 – Risk not compensated by returns at current volatility levels
- Avg. Return 30d: −0.00039 – Short-term bullish momentum absen
- RSI (14, 1h): 53.74 – Neither overbought nor oversold, no directional bia
- Taker Buy/Sell Ratio: – Rising – Trending upward across all exchanges, resembles pre-surge structure from April 2025
The interpretation carries an important nuance. A negative Sharpe reading does not mean ETH is about to fall further—it is a backward-looking measure of how efficiently the asset has rewarded risk exposure over the past 30 days. What it does reflect is that speculative activity has cooled and liquidity flows have weakened recently. Markets in this configuration tend to consolidate sideways until a catalyst, external or structural, forces directional commitment from participants.
Historically, extended periods of negative risk-adjusted return in ETH have often preceded either a sustained further decline or a sharp mean-reversion rally. The metric by itself cannot distinguish between those outcomes.
The Bullish Counter-Narrative: Taker Buy Pressure
Against the bearish backdrop of the Sharpe data and the whale short, a separate on-chain indicator is flashing in the opposite direction—and doing so with historical precedent attached to it.
Ethereum’s Taker Buy/Sell Ratio, tracked across all major exchanges by CryptoQuant, is currently trending upward. The metric measures the ratio of aggressive buy orders (market takers lifting the ask) versus aggressive sell orders (takers hitting the bid), with a rising reading indicating that buyers are increasingly willing to pay the ask rather than wait for sellers—a behavioral signature of genuine demand rather than passive accumulation.
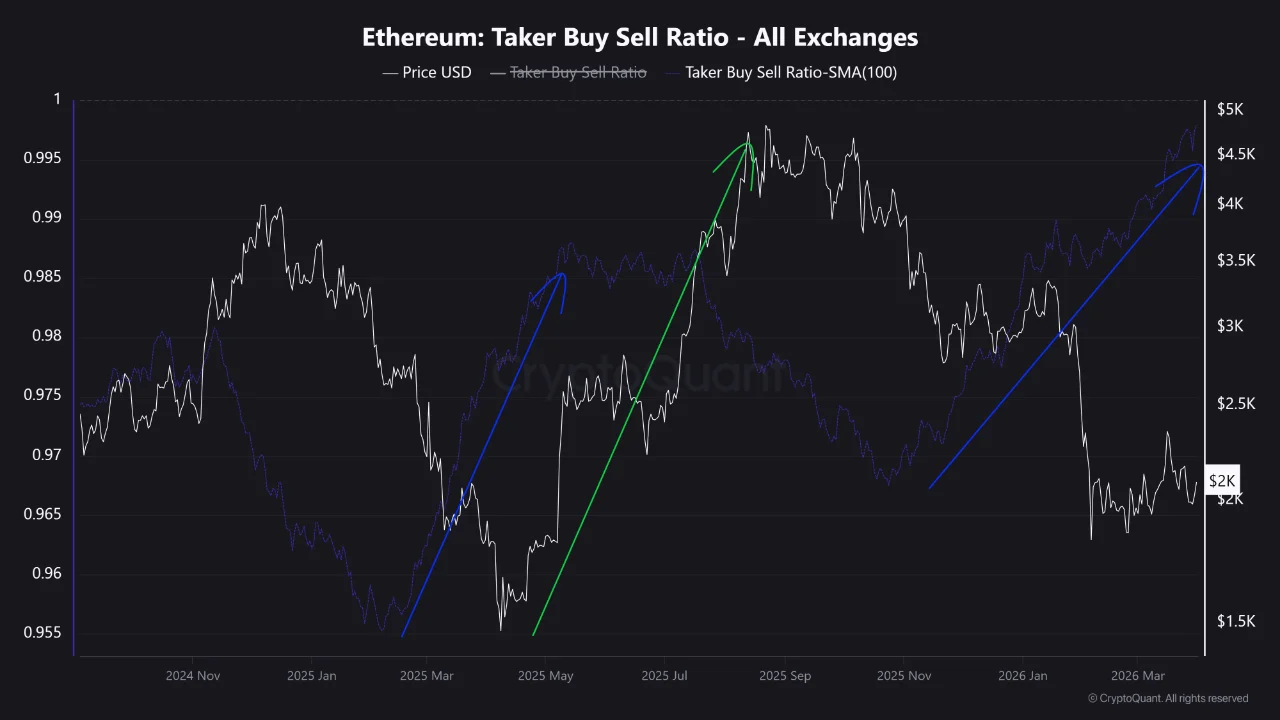
What makes the current reading notable is its pattern shape. The structure forming in the Taker Buy/Sell Ratio over the past several weeks bears a recognizable resemblance to the trend that developed during the February–April 2025 period, just before ETH staged a sharp rally into May of that year. At that time, the ratio climbed steadily from a low of roughly 0.955 toward 0.985 before the price broke upward decisively. The current trajectory appears to be replicating that arc—beginning from a similar low base and ascending with what analysts describe as a developing structure of sustained spot demand.
Taker pressure of this kind is generally regarded as a more reliable signal than order book depth alone, because it captures what participants are actually doing rather than what they are merely advertising. Rising taker buy pressure suggests that at the current price range, real money is being deployed into ETH on the spot market, not just futures positioning.
When taker buy pressure builds while price holds above a key moving average, the setup has historically resolved to the upside more often than not—provided no macro shock intervenes.

Three Signals, One Asset, No Easy Answer
Taken together, these three data points form a genuinely contested picture. The whale short is a large, informed bet that ETH’s current price is unsustainable or that an external catalyst, macro deterioration, regulatory risk, or simply continued weak momentum, will push it lower. The position is not reckless: the liquidation buffer above $2,466 provides meaningful room for the thesis to develop before the trade is forced closed.
At the same time, the taker buy pressure data represents a structural counter-argument. If real spot demand is systematically building at these levels—if the ratio continues rising the way it did in early 2025—then the pool of forced liquidations above the whale’s entry point becomes a relevant consideration. A forced-buy cascade at $2,466 into a market with rising buy pressure could, in the right conditions, prove self-reinforcing.
The Sharpe ratio data occupies a middle position: it is consistent with either outcome. A market transitioning out of negative risk-adjusted returns can do so by declining to a new lower-volatility level, or by rallying sharply as suppressed demand releases. The negative reading indicates not which direction, but that a transitional period is likely underway.
What resolves this tension will likely not be found in the on-chain data itself. Broader macro uncertainty around Iran war continues to weigh on risk assets, and crypto has shown in recent months that its correlation with equity sentiment remains elevated during periods of stress. A risk-off macro development would hand the whale’s short thesis its cleanest possible argument. A bullish macro turn, conversely, could ignite the taker pressure signal into something more consequential.
Key Levels to Watch
For those actively trading or managing exposure through this setup, the structural reference points are relatively clear:
- $2,000 – Psychological support and lower bound of current range. A daily close below shifts the technical picture toward the short thesis.
- $2,038 – SMA(50) on the hourly chart. The immediate line in the sand; price holding above maintains a tentative bullish bias.
- $2,090–$2,100 – Resistance tested multiple times over the past two days. First meaningful hurdle for bullish continuation.
- $2,200 – Next level of significance above range resistance.
- $2,466 – The whale’s liquidation price. A magnet if momentum builds; a forced-buy catalyst if reached.
Ethereum, for now, is doing what it does in genuinely ambiguous moments: it is making everyone uncomfortable and offering nothing for free.
The information provided in this article is for educational purposes only and does not constitute financial, investment, or trading advice. Coindoo.com does not endorse or recommend any specific investment strategy or cryptocurrency. Always conduct your own research and consult with a licensed financial advisor before making any investment decisions.
The post Ethereum’s Taker Pressure Is Rising: A Whale Is Betting Against It appeared first on Coindoo.
