


OIL Price Prediction 2026: Bearish Head & Shoulders Signals Potential 34% Drop
 OIL
OIL
Key Highlights
- Bearish Pattern: OIL is forming a classic Head & Shoulders reversal, signaling that the long-term uptrend is losing steam.
- Critical Rejection: Prices recently hit a wall at $101, confirming the "Right Shoulder" and a shift in market control to the bears.
- Geopolitical Shift: Recent ceasefire optimism is stripping away the "risk premium," providing the fundamental catalyst for a move lower.
- 34% Target: A breakdown below the $87.57 neckline would trigger a technical sell-off toward a primary target of $63.71.
The global energy market is at a critical juncture as Crude Oil faces intense selling pressure following a volatile period of geopolitical maneuvering. After a significant rally earlier this year, technical indicators are now flashing red, suggesting that the era of triple-digit oil prices is facing a serious challenge.
As of today, April 25, 2026, Crude Oil Brent is trading at $97.62, down 2.69% over the last 24 hours. While the asset has maintained a 12.66% gain over the past week, the momentum is stalling.
 Crude OIL Price/Source: Coinmarketcap
Market sentiment shifted significantly following the April 6 announcement of a two week ceasefire between the U.S. and Iran, which initially caused oil to slump as fears of a prolonged blockade in the Strait of Hormuz eased. However, prices have remained unstable this week as peace talks in Islamabad appear to be stalling, leading to “zig-zag” price action between $95 and $104. Investors are now laser-focused on whether the ceasefire extension will hold or if a renewed military escalation is on the horizon.
Technical Analysis: Potential Head & Shoulders in Play
From a technical standpoint, OIL is showing early signs of a potential Head and Shoulders (H&S) formation on the daily chart—a pattern often associated with trend reversals.
Current Structure:
- Left Shoulder: Formed near the $101 mark as the initial wave of buying exhausted.
- Head: A surge in regional tensions pushed prices to a peak rejection at $118.38. The subsequent ceasefire talk on April 6 acted as the catalyst that forced the price back down to test the $87.57 neckline support zone.
- Right Shoulder: The price is currently carving out the right shoulder. Recent attempts to push higher were rejected again near $101, mirroring the left shoulder and confirming that bears are defending this level.
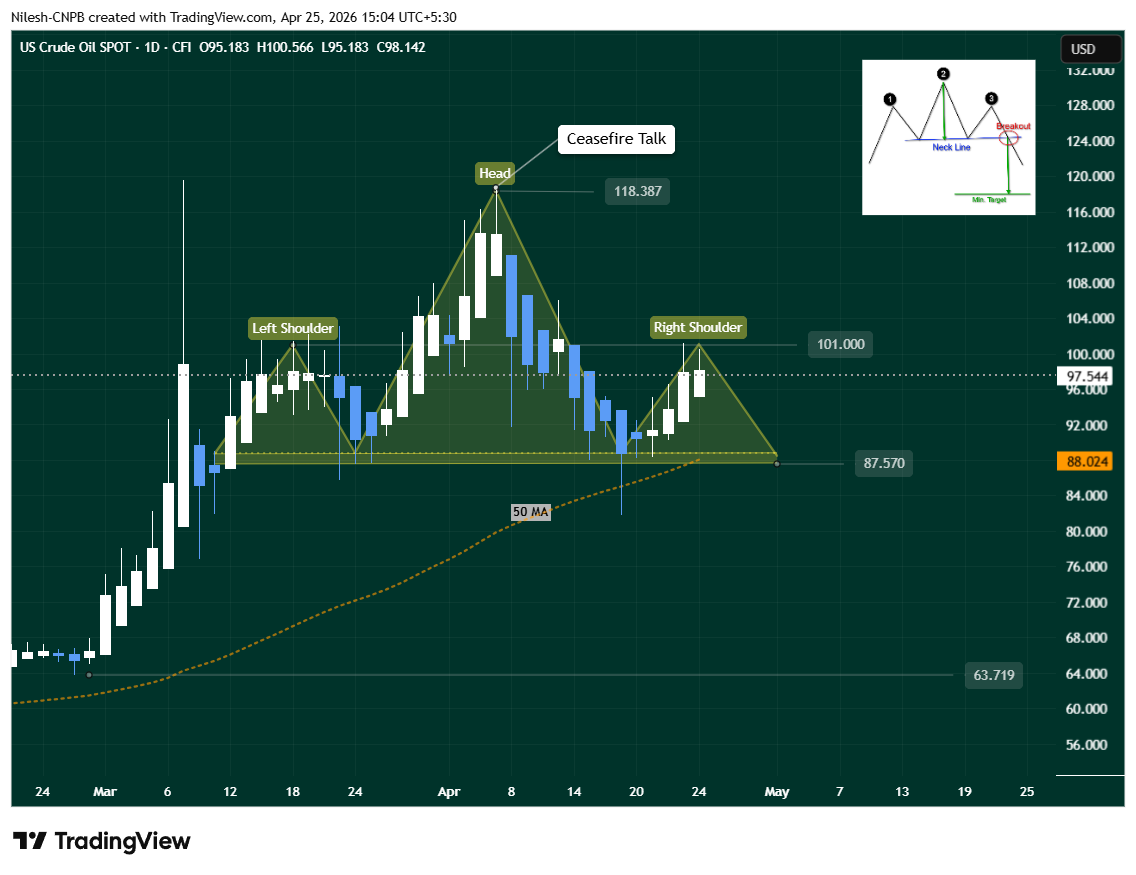 OIL Daily Chart/Coinsprobe (Source: Tradingview)
What’s Next for OIL?
OIL is currently in its “last session” near the $100 psychological level. If the pattern continues to play out, we expect a slide in the coming days to retest the neckline support at $87.57.
The Critical Breakdown:
A decisive break below the $87.57 neckline, which currently aligns with the 50-day Moving Average (MA), would likely confirm a major trend shift.
If this support fails, the primary technical target sits at $63.71—representing a potential 34% drop from current prices. This scenario would likely be triggered by a successful reopening of the Strait of Hormuz and a permanent de-escalation of the U.S.-Iran conflict.
The Flip Side
Conversely, technical patterns are not guarantees. This bearish setup would be completely invalidated if the price reclaims and closes above the recent peak of $118.37. Such a move would signal that supply fears have overtaken diplomatic efforts, likely sending oil back into a parabolic uptrend.
FAQ Section
What is causing the current drop in oil prices?
The primary drivers are technical exhaustion at the $101 resistance level and market optimism regarding the U.S.-Iran ceasefire extension. Traders are weighing the potential for a diplomatic resolution in Pakistan against the ongoing maritime blockade in the Strait of Hormuz.
How certain is the “Head and Shoulders” reversal pattern?
While the structure is well-defined, it is not “confirmed” until the price closes decisively below the $87.57 neckline. Until that breakdown occurs, the pattern remains in the “formation” stage and could still be invalidated.
What happens if oil breaks below $87.57?
A breakdown below this support, especially if accompanied by high trading volume, typically triggers a massive sell-off. Technically, this opens the door for a move toward $63.71, as it signals that the long-term bullish trend has officially shifted to bearish.
What could stop oil from falling further?
The setup is invalidated if OIL reclaims and closes above $118.37. Geopolitically, if the Islamabad peace talks collapse and military threats return to the Strait of Hormuz, the “geopolitical risk premium” would likely drive prices back toward record highs, regardless of the technical pattern.
Disclaimer: The views and analysis presented in this article are for informational purposes only and reflect the author’s perspective, not financial advice. Technical patterns and indicators discussed are subject to market volatility and may or may not yield the anticipated results. Investors are advised to exercise caution, conduct independent research, and make decisions aligned with their individual risk tolerance.
Also Read: Missed the APE Rally? This MultiversX (EGLD) Setup Could Trigger the Next Bullish Move.
