


Ondo Gains After Franklin Templeton ETF Tokenization Deal
ONDO
 FLY
FLY
 FRANKLIN
 ETF
ETF
 GAINS
GAINS
Key Insights
- Ondo gained eight percent after partnering with Franklin Templeton, boosting visibility and signaling deeper integration between traditional finance and blockchain-based investment products globally.
- Tokenized ETFs will enable round-the-clock trading through crypto wallets, expanding access for non-US investors and removing limitations tied to conventional market operating hours.
- Technical charts show a bullish breakout, yet mixed indicators and strong resistance at $0.30 suggest cautious momentum despite growing institutional interest and platform expansion.
Ondo recorded a sharp price increase after confirming a partnership with Franklin Templeton to introduce tokenized exchange-traded funds on blockchain networks. The token climbed around eight percent, reaching a weekly high near $0.27 before easing slightly to $0.26. Besides the immediate price response, the announcement shifted attention toward how traditional finance firms are deepening blockchain integration.
The planned rollout includes five ETFs covering United States equities, bonds, and gold. These assets will trade continuously through crypto wallets rather than standard market hours. Consequently, global investors can access these instruments without geographic barriers. Additionally, the structure removes time constraints that often limit participation in traditional markets.
Institutional Backing Strengthens Position
Franklin Templeton manages nearly $1.7 trillion in assets, which adds weight to the collaboration. Moreover, the association increases Ondo’s visibility among institutional players exploring tokenized finance. This development aligns with broader efforts to bridge traditional assets with blockchain infrastructure. Hence, Ondo continues to position itself within the expanding real-world asset sector.
Ondo Finance now oversees more than $2.7 billion in tokenized assets. Recently, the platform added around sixty new tokenized stocks and ETFs. This expansion brings the total offering to over 250 assets across Ethereum, Solana, and BNB Chain. Furthermore, the steady increase in listings reflects growing demand for blockchain-based exposure to conventional financial products.
Technical Breakout Signals Upside
Price charts show Ondo breaking out of a falling wedge pattern, which traders often interpret as a bullish reversal signal. The breakout suggests potential continuation of upward movement over several sessions. Significantly, projections indicate a possible move toward the $0.50 to $0.64 range if momentum sustains.
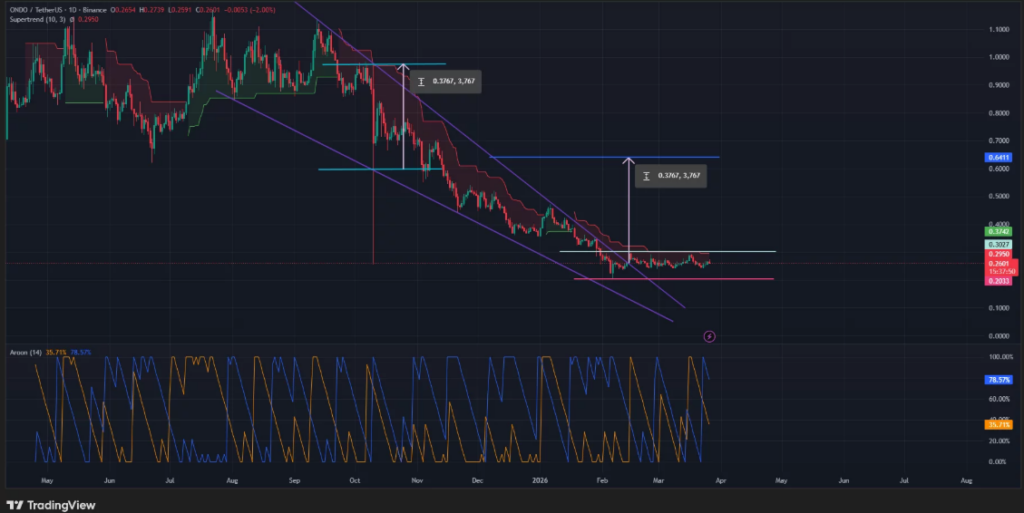
However, not all indicators support a clear bullish trend. The Supertrend indicator remains negative, suggesting lingering bearish pressure. Additionally, the Aroon Down indicator stays higher than the Aroon Up, which signals stronger selling activity. These conflicting signals highlight uncertainty despite the breakout pattern.
The $0.30 level continues to act as a major resistance point, where the price faced rejection earlier in February. A move above this level could strengthen bullish momentum. On the downside, a drop below $0.20 would weaken the current outlook and could reverse recent gains.
