


PEPE Price Climbs as Bulls Test Key Resistance Breakout
 TST
TST
 Test
Test
 Test
Test
 Test
Test
 Test
Test
Key Insights
- Pepe's price rises for three days as improving sentiment boosts retail demand, supported by stronger participation and steady gains in futures open interest.
- Futures open interest climbs above $213 million, signaling growing trader confidence as rising positions align with spot price recovery and reinforce short-term bullish expectations.
- Pepe tests resistance near $0.00000400 as technical indicators show strength, while sustained momentum could drive price toward the $0.00000500 level in the coming sessions.
Pepe trades higher for a third straight session on Wednesday as improving market sentiment supports risk assets across the crypto sector. Besides easing downside pressure, renewed retail participation drives fresh demand for meme coins during the current recovery phase. Consequently, traders respond to broader optimism following geopolitical developments that helped stabilize market conditions.
The Fear and Greed Index stands at 62, reflecting a steady rise in risk appetite among investors. Moreover, the shift toward a more favorable environment encourages short-term accumulation in speculative assets like Pepe. This trend highlights how sentiment continues to guide price action across the meme coin segment.
Derivatives Activity Signals Growing Interest
PEPE derivatives data shows rising engagement as futures Open Interest reaches $213.18 million after gaining over seven percent within 24 hours. Additionally, the increase in outstanding positions aligns with the ongoing spot price recovery, indicating stronger participation from traders. This pattern often reflects growing confidence in near-term price movement.
Significantly, higher Open Interest during a price rebound suggests that traders anticipate further upside. Hence, the derivatives market supports the current bullish narrative, reinforcing expectations of continued recovery if momentum holds.

Price Structure Faces Key Resistance Test
Pepe continues its rebound after bouncing from the 50-day Exponential Moving Average near $0.00000368 earlier this week. However, the broader trend remains under pressure as the 100-day and 200-day moving averages continue to slope downward. Moreover, a descending resistance trendline from January and April highs limits upward expansion.
The price now approaches a critical zone near $0.00000400, which aligns closely with the 100-day moving average. A decisive move above this level could open the path toward the $0.00000500 region. Consequently, this resistance area remains the immediate focus for traders tracking breakout confirmation.
Momentum Indicators Support Short-Term Strength
Technical indicators show improving conditions as the Relative Strength Index climbs to 58, signaling mild bullish momentum. Additionally, the MACD continues to trend above its signal line with positive histogram bars, confirming strengthening buying pressure. These signals suggest that the current recovery retains support in the short term.
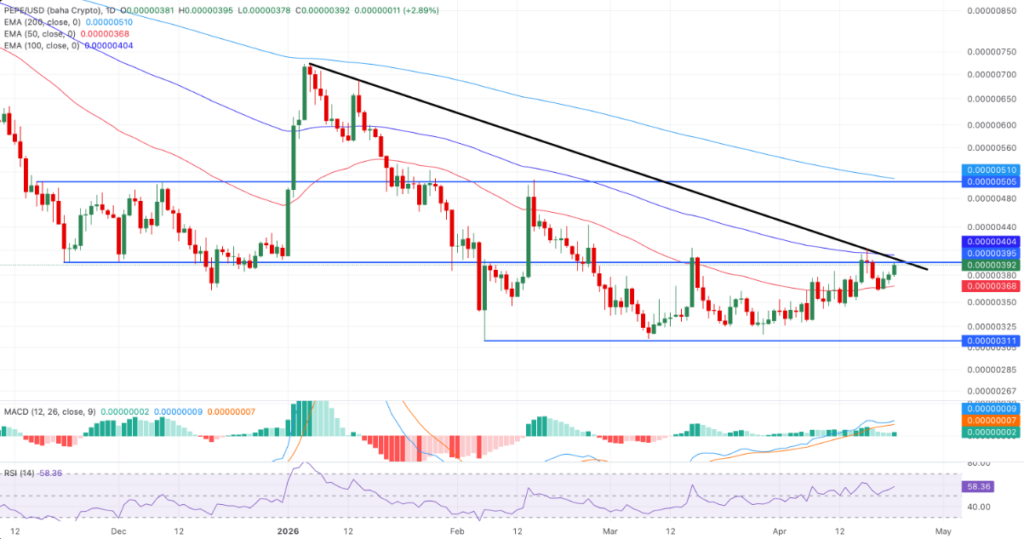
However, price action must sustain above key levels to maintain momentum. The 50-day moving average continues to act as immediate support, protecting the downside near $0.00000368. A break below this level could expose the February low near $0.00000311.
