


Solana Eyes $87 Breakout as Bullish Signals Strengthen
 BULLISH
 SOL
SOL
 RES
RES
 DAILY
DAILY
Key Insights
- Solana trades near $87 resistance, as strong on-chain activity and positive funding rates indicate rising bullish pressure across spot and futures markets
- Whale accumulation and buy-side dominance in derivatives markets support continued upside potential, reinforcing momentum after three consecutive days of gains this week
- Technical indicators show modest strength as RSI stays above 50 while MACD remains positive, signaling buyers are gradually building control near key resistance levels
The Solana price trades at $86.13 on Thursday after posting three straight days of gains this week. The asset now approaches a critical resistance zone near $87, where technical pressure remains firm. Besides, price action continues to stay inside a parallel channel, reflecting controlled upward movement.
CryptoQuant data shows improving on-chain conditions supporting a bullish outlook for SOL. Large whale orders appear active in spot markets, while overall conditions cool after earlier volatility. Additionally, this shift suggests accumulation behavior, which often aligns with upward price continuation in similar setups.
Derivatives Market Shows Buy-Side Dominance
Futures market data highlights strong buy-side activity, reinforcing the bullish case. Funding rates turned positive earlier in the week and climbed to 0.0016% on Thursday. Consequently, traders holding long positions now pay shorts, a pattern that has historically preceded strong upward price movements.

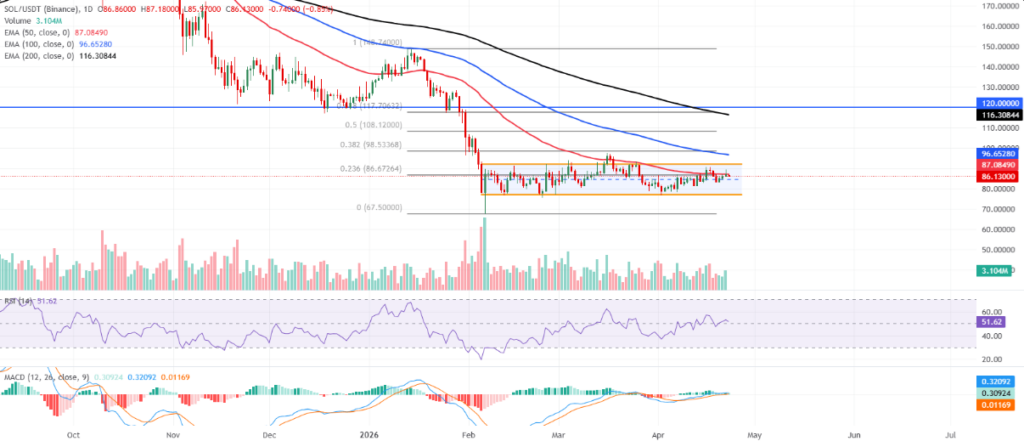
Daily chart indicators show early signs of strength, although resistance remains intact. The Relative Strength Index holds slightly above the neutral 50 level, indicating mild bullish momentum. Moreover, the MACD remains marginally positive, suggesting that buyers continue to test control despite overhead supply.
Key Resistance Levels Limit Immediate Upside
Immediate resistance sits at the 23.6% Fibonacci retracement level near $86.67. The 50-day EMA at $87.08 adds further pressure, as SOL has not yet reclaimed this level. Hence, a confirmed breakout above this zone could open the path toward $92.11 and later the 100-day EMA near $96.65.
On the downside, the lower boundary of the channel near $77.12 offers initial support. A breakdown below this level could shift momentum and expose the next major support near $67.50. However, the current structure shows buyers actively defending higher levels within the channel range.
Market Structure Keeps Traders Focused on Breakout
SOL continues to trade in a tightening range as buyers and sellers contest key technical levels. Significantly, the combination of rising funding rates, whale activity, and stable price action keeps attention on a potential breakout. Market participants now watch the $87 zone closely for directional confirmation.
