


Solana Price Holds Range as $90 Resistance Caps Breakout
 SOL
SOL
 MASS
MASS
 RES
RES
 XMM
XMM
 MMT
MMT
Key Insightsthe price
- Solana trades between $85 and $86 after a pullback, while an ascending channel pattern supports bullish structure with strong demand near support levels.
- Momentum indicators, including MACD and Aroon, suggest strengthening buying pressure, reinforcing expectations of a potential breakout above the critical $90 resistance level soon.
- A successful move above $90 could push Solana toward $94 to $96, while continued rejection may keep price within range near $80 support.
Solana trades within a narrow range as price action stabilizes after recent volatility. The token currently holds near the $85 to $86 zone. This follows a pullback from its recent high near $89.
The recent decline shows controlled selling rather than sharp liquidation across markets. Buyers continue to defend higher levels despite short-term pressure. Hence, the trend still reflects underlying strength within the current structure.
Ascending Channel Supports Trend Structure
The daily chart highlights a clear ascending channel pattern forming over time. This structure shows consistent higher highs and higher lows. Consequently, it signals steady accumulation as buyers step in at elevated price levels.
The lower boundary of the channel remains anchored around the $78 to $80 range. This level has repeatedly acted as a strong support base. Moreover, price reactions around this zone confirm sustained buyer interest.
Resistance Near $90 Limits Upside
The upper boundary of the channel aligns closely with the $90 resistance level. This level has capped upward moves for nearly a week. However, repeated tests suggest growing pressure from buyers attempting a breakout.
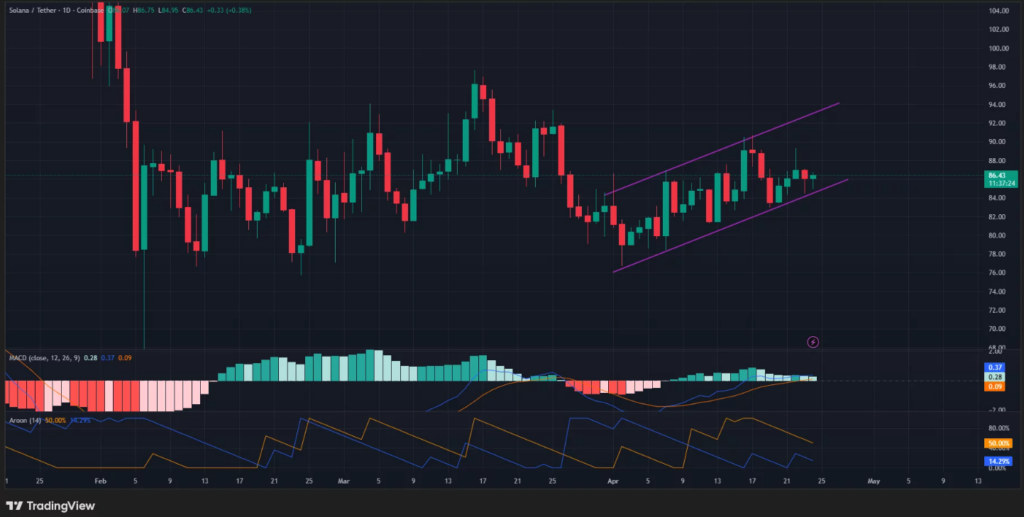
Source: TradingView
Technical indicators show improving momentum despite recent consolidation. The MACD histogram has turned positive, indicating a shift in trend strength. Additionally, the signal line crossing supports a bullish continuation setup.

Aroon Indicator Signals Strength
The Aroon Up indicator trends higher while Aroon Down remains subdued. This pattern reflects increasing dominance of buyers in the market. Hence, it strengthens the case for a potential upside continuation.
The tight trading range between $85 and $86 reflects a period of consolidation. Such patterns often precede strong directional moves. Besides, reduced volatility indicates market participants are positioning for the next phase.
Breakout Scenario Targets Higher Levels
A confirmed move above $90 could validate the ascending channel continuation. This breakout may open the path toward the $94 to $96 range. Significantly, this zone represents the next visible supply area.
If price fails to clear the $90 resistance, consolidation may continue. The market could remain confined within the current channel structure. Consequently, downside pressure may push price toward the $80 support region.
Market Structure Remains Bullish
Despite short-term resistance, the broader structure supports a bullish outlook. Higher lows indicate sustained accumulation across sessions. Moreover, steady demand continues to absorb selling pressure effectively.
Market participants show cautious positioning as price approaches key resistance. Buyers gradually increase exposure without aggressive entries. Hence, this behavior supports a controlled buildup toward a potential breakout.
