


XRP Forms Triangle Pattern, Analyst Predicts a 35% Surge
 MASS
MASS
 XMM
XMM
 XRP
XRP
 MMT
MMT
 SURGE
SURGE
- XRP shifted from a downtrend to consolidation, trading between 1.30 support and 1.50 resistance as moving averages converge.
- A symmetrical triangle forms with price near 1.41, signaling a potential 35% move if a strong breakout confirms direction.
- RSI and MACD show mixed momentum, hinting at recovery, but lack of volume keeps breakout confirmation uncertain for now.
XRP trades near 1.41 after weeks of decline and recent stabilization, according to analyst Ali. The digital asset moved from a strong downtrend into consolidation between mid-February and now.
Downtrend Shifts Into Consolidation Phase
Initially, XRP remained in a sustained bearish structure with consistent lower highs and lower lows. Price stayed below both the MA50 and MA200, while the MA200 trended downward steadily. Meanwhile, the MA50 tracked closer to price, reflecting short-term fluctuations during the decline.
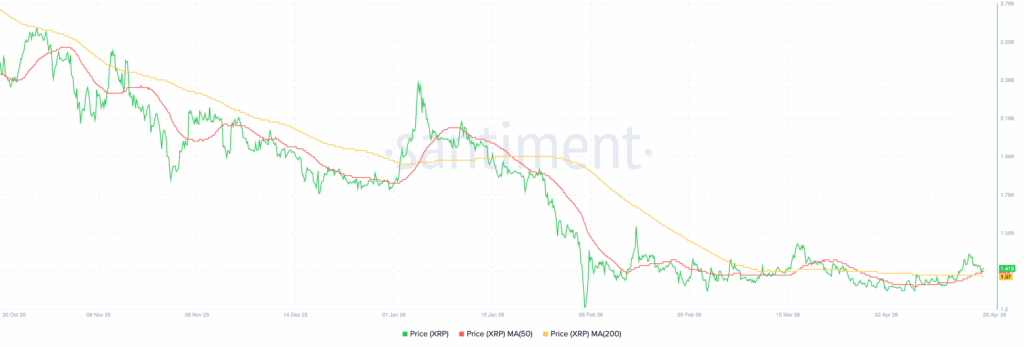
However, a sharp move in early January briefly pushed price above the MA50. That attempt failed quickly, and price dropped back below both averages. Soon after, early February saw a steep fall toward 1.20, a local bottom.
From there, the structure changed. Price stabilized and moved sideways between 1.30 and 1.50. Notably, the MA50 flattened and began converging with price, while the MA200 slowed its decline.
Range Structure Defines Near-Term Levels
As consolidation developed, XRP traded around 1.37 to 1.41, slightly above the MA50 and near the MA200. This area now acts as a transition zone between prior weakness and current balance. Resistance is between 1.50 and 1.60, while support remains near 1.30.
In the shorter term, price formed a tighter range. It climbed from 1.33 to 1.50 with higher highs and higher lows. After reaching resistance, it pulled back toward 1.40 to 1.42.

Currently, the range is between 1.40 support and 1.45 resistance. Volume remains moderate near 1.02 million, without a strong breakout confirmation.
Momentum Indicators Show Mixed Signals
Momentum data provides additional context to this structure. The RSI is at 49.31, slightly below neutral, indicating softer bullish strength. However, the RSI signal line has turned upward, suggesting a recovery attempt.
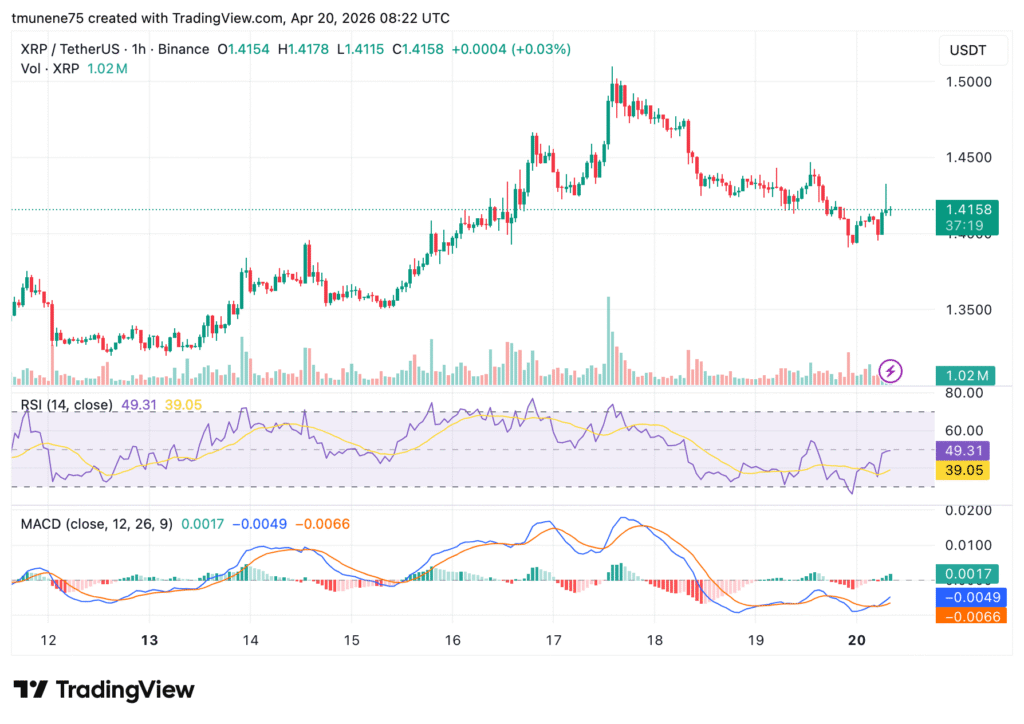
Meanwhile, MACD shows early convergence. The MACD line trends upward toward the signal line, while the histogram becomes less negative.
These shifts align with the analyst’s observation that XRP forms a symmetrical triangle. The setup points to a potential 35% move if price exits the current structure decisively.
The post XRP Forms Triangle Pattern, Analyst Predicts a 35% Surge appears on Crypto Front News. Visit our website to read more interesting articles about cryptocurrency, blockchain technology, and digital assets.
